November Jobs Report Rebounds from October’s Disappointing Results
- November nonfarm payrolls rose 224 thousand, just above the 215 thousand expected and 36 thousand in October (revised up from an initial 12 thousand). September was also revised up by 32 thousand jobs to 225 thousand, which goes against the year-long trend of lower revisions. Given, all the noise from hurricanes and strikes, the three-month average in job gains is 173 thousand vs. 123 thousand in October. With the increase in immigration, it’s thought that approximately 200k in monthly job gains are needed to maintain labor market equilibrium. We would be remiss, however, if we didn’t note that the immigration inflow is likely to slow, perhaps dramatically, under the Trump administration, so that equilibrium level is likely to shift lower. But if demand remains strong, watch for increasing wage gains as employers fight for a more limited pool of workers.
- Once again, the two surveys used in the report told a different story. The Household Survey (which generates the unemployment rate, labor force participation rate, etc.) reported a decrease of 355 thousand jobs with an increase of 161 thousand in the ranks of the unemployed (7.145 million vs. 6.262 million a year ago). It also reported a 193 thousand drop in the labor force. That less optimistic view of the labor market led to the unemployment rate increasing from 4.1% (4.145% unrounded) to 4.2% (4.246% unrounded), so call it a “high” 4.2% which was above the 4.1% expectation.
- While the Household Survey uses a smaller sample size, and thus is subject to more volatility when extrapolated to the entire population, it is interesting that compared to a year ago, the number of employed persons decreased by 725 thousand compared to the Establishment Survey’s average monthly gain of 186 thousand over the past 12 months. It’s not unusual for the two surveys to diverge at times but usually they come back in sync. That hasn’t been the case in the past year with the Household Survey consistently painting a mediocre-at-best labor market picture. Something doesn’t add up.
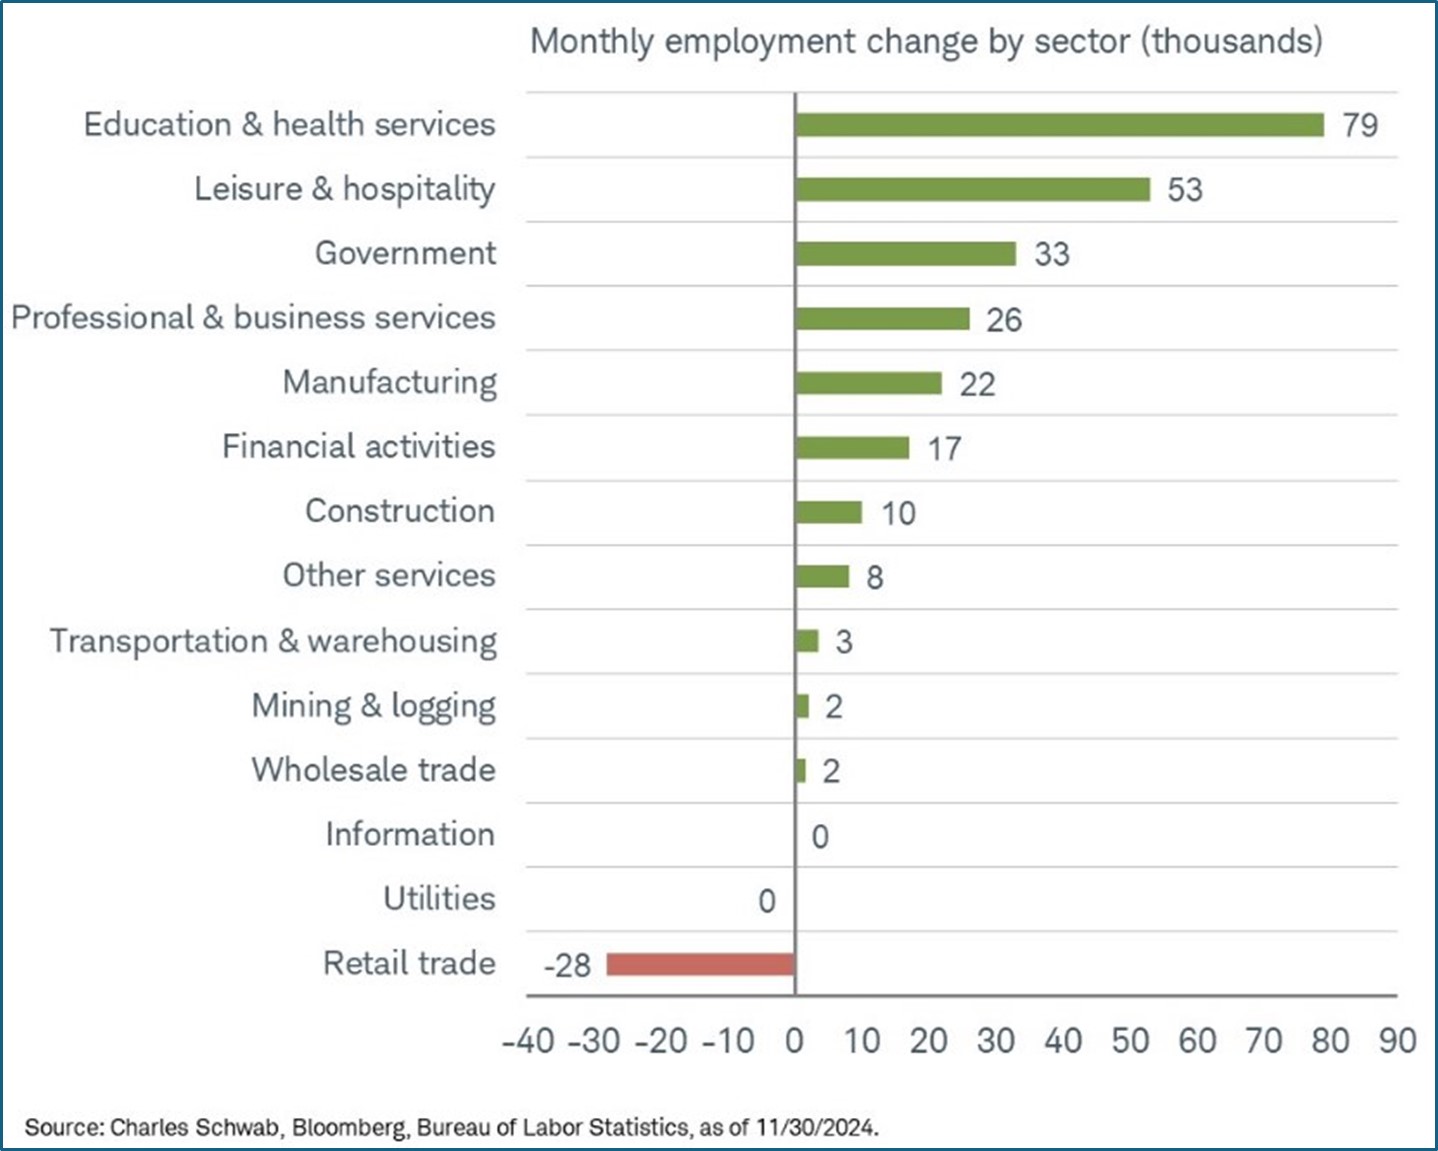
- Job gains were strongest in healthcare/social assistance, a perennially strong category, (54k), while leisure/hospitality rebounded after a soft October (53k). Government job growth continued strong (33k), and durable goods manufacturing surprised (26k), which agrees with the stronger ISM Manufacturing numbers we saw earlier in the week. Job losses were concentrated in retail trade (-28k), and after eight straight months where temporary help services shed jobs, this time they managed a meager 1.6 thousand new jobs. The job losses in retail trade are curious given the hiring that happens during the holiday season. Perhaps some seasonal adjustment factors at play and the seasonal hiring could also explain the modest rebound in temp help jobs.
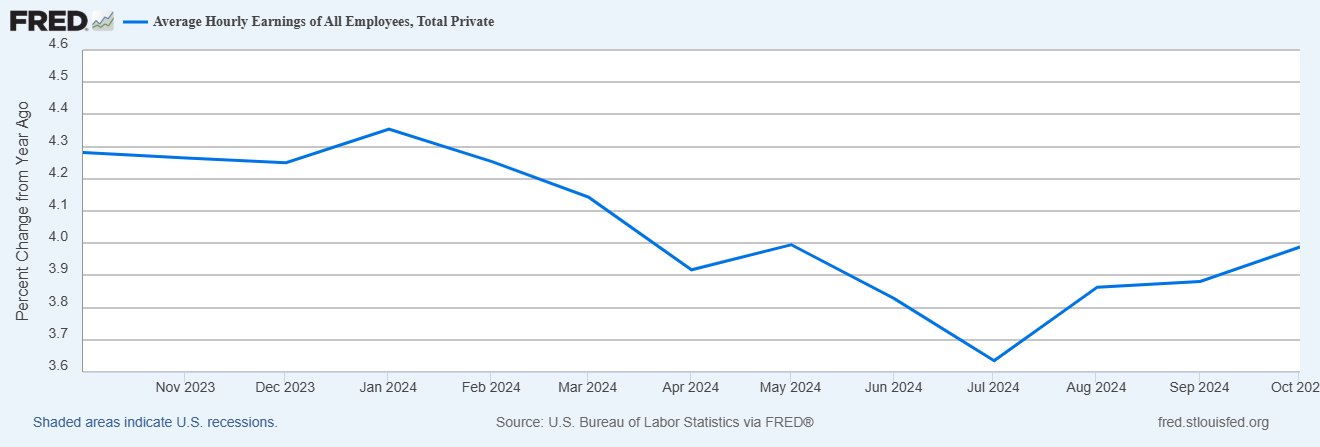
- Average Hourly Earnings rose 0.4% MoM, beating the 0.3% expectation and matching the 0.4% October gain. The year-over-year pace was unchanged at 4.0%, beating the 3.9% expectation. In addition, average weekly hours ticked two-tenth higher to 34.4, beating the 34.3 expectation and October’s 34.2 hours. The back-to-back 0.4% MoM gains in earnings combined with the increase in hours worked paints a solid earnings picture for the consumer.
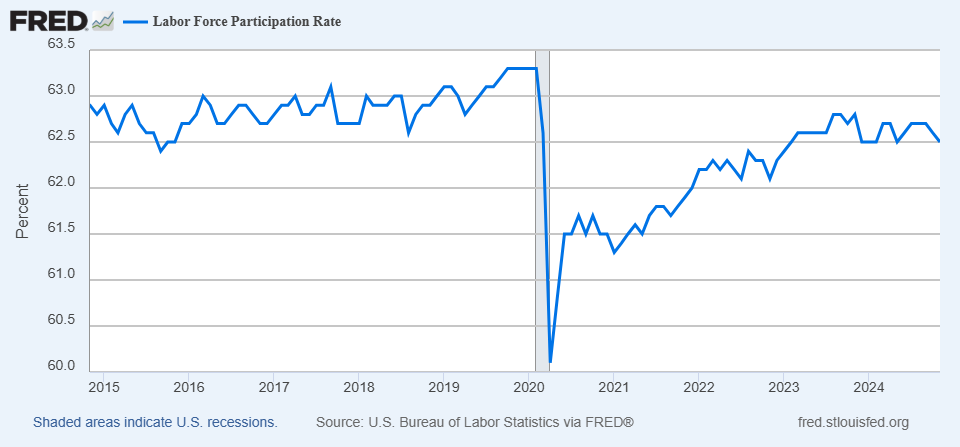
- With the decrease in the labor force, the Labor Force Participation Rate dipped a tenth to 62.5%, missing the more upbeat 62.7% expectation. The rate was 62.8% a year ago, so the slide in participation is another puzzle that speaks again to the more pessimistic labor market read coming from the Household Survey.
- The November’s jobs report was expected to rebound off a soft and noisy October and that’s what it did. The rebound, however, isn’t likely to dim odds of a 25bps rate cut at the December 18th FOMC meeting. The echoes of the hurricanes and strikes continue to create noise around this month’s results such that the Fed isn’t likely to alter policy. The wage gains were solid, along with the increase in hours worked, and that should buttress consumer spending during the holiday shopping season. However, the disparity between the upbeat Establishment Survey contrasts and confounds against the less positive Household Survey. However, the wage gains and other labor metrics (JOLTS and Jobs Plentiful – Jobs Hard to Get) that improved modestly during the month will play into a pause early in 2025. The inflation numbers due next week, however, will have a stronger say in that outcome.
- In another sign of reluctance to lay off fulltime workers, initial jobless claims from yesterday remained muted. Claims for the week ended November 30 were 224 thousand, just above the 215 thousand forecast and 215 thousand the prior week. Continuing claims, however, fell from 1.896 million to 1.871 million, below the 1.904 million expectation. The next step in labor market weakness will be increasing layoffs, particularly in the services sector, and we’re just not seeing that in the claims figures yet.
- Finally, the November ISM Services Index was released yesterday, and while all the measures missed expectations, they all remained above 50, indicating the sector continues to expand. So, the largest, and healthiest, part of the economy remained so in November as the headline reading was 52.1 vs. 55.7 expected and 56.0 in October. The employment metric softened from 53.0 to 51.5, while the new orders metric rose fell from October’s 57.4 to 53.7, and the prices paid component rose slightly from 58.1 to 58.2. So, while some softening was seen in the results versus a robust October, the sector remains in expansionary territory, but keep an eye out for any further weakening.

Securities offered through the SouthState | DuncanWilliams 1) are not FDIC insured, 2) not guaranteed by any bank, and 3) may lose value including a possible loss of principal invested. SouthState | DuncanWilliams does not provide legal or tax advice. Recipients should consult with their own legal or tax professionals prior to making any decision with a legal or tax consequence. The information contained in the summary was obtained from various sources that SouthState | DuncanWilliams believes to be reliable, but we do not guarantee its accuracy or completeness. The information contained in the summary speaks only to the dates shown and is subject to change with notice. This summary is for informational purposes only and is not intended to provide a recommendation with respect to any security. In addition, this summary does not take into account the financial position or investment objectives of any specific investor. This is not an offer to sell or buy any securities product, nor should it be construed as investment advice or investment recommendations.


