More Indications of Labor Market Weakness
More Indications of Labor Market Weakness
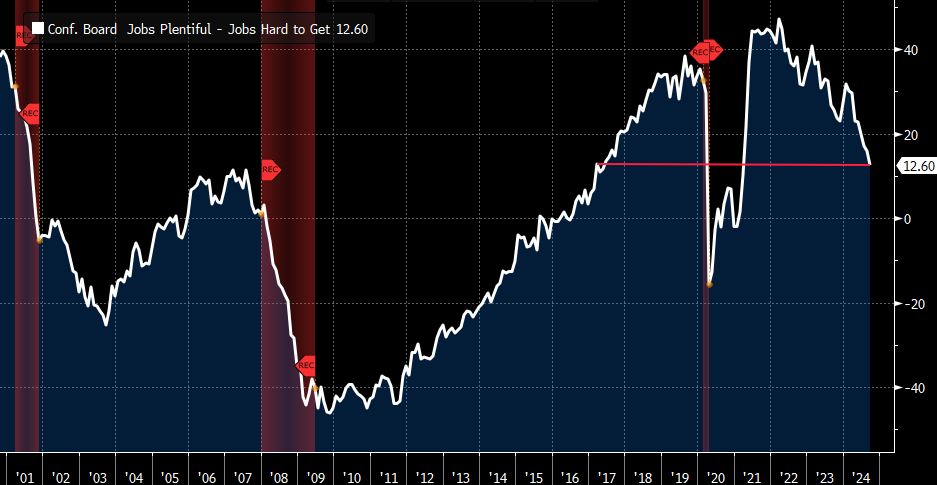
- If you’re looking to check boxes on what could force another 50bps cut in November, you got one yesterday. The Conference Board’s September release showed a considerable slide in confidence (from 105.6 to 98.7) and while that rivals the 97ish prints in June and April, it was the labor differential number that highlighted more softening in the labor market that got traders attention. The jobs plentiful minus jobs hard to get declined for the eight straight month, to a 7-year low (see graph below). So, while the BLS employment reports for September and October will have the final say on a November cut, and its size, these secondary indicators continue to point to further labor market softening.
- Just when we mentioned China weakness, and the lack of a response from the government, they responded. Rate cuts and reduced reserve requirements, and a lending facility aimed at boosting equity purchases were an impressive array of actions. And while the additional liquidity and lower lending rates may help at the margins, the Chinese are dealing with a balance sheet recession as property prices plummet in the face of oversupply and waning demand. That sounds like our Great Financial Crisis, where many suffered declines in home values approaching 50%, which dented consumer’s net worth and subsequently dented demand.
- China is facing a similar situation with declining property values and softening demand. These balance sheet recessions aren’t cured overnight as we remember from the decade following the GFC when the economic recovery was painfully slow. Similarly, the weakening in China is likely to be a slow process that will weigh on global growth and commodity prices for the immediate future. While the Fed doesn’t adjust policy based on international situations per se, the struggles in China and the weakening growth picture in Europe will have some negative ripple effects across the pond. Just another reason to believe the Fed may be aggressive in this rate-cutting cycle.
- Something else to ponder as we try to game the Fed’s rate-cutting pace and size, is the looming first quarter seasonality of higher inflation prints. Recall the uptick in inflation in the first quarter this year. Companies typically put in wage/salary increases and price hikes when the calendar turns to January. The residual impact continues into February, and this year it stretched into March. If that seasonal pattern repeats, and we have no reason to expect it won’t, the Fed will find it hard to cut in the face of hot inflation prints in the first quarter. Thus, it may be that the Fed will have to pause in the first quarter, so better to get further down the easing path before then. Does that mean a 50bps cut in November and December? It’s a possibility, especially if labor market weakness continues.
- While the Fed’s dot plot from last week saw 100bps in cuts by year-end (with 50bps already in place), the futures market sees 60% odds of another 50bps cut in November and 54% odds of the same in December, ending the year at 4.04%. That compares to the latest dot plot median for 2024 at 4.375%.
- The curious thing is that while there are clear signs of slowing in the labor market, overall economic growth hasn’t been dented yet. The Atlanta Fed’s GDPNow model is predicting 3rd quarter GDP at 2.93% which certainly doesn’t flash any warning signals. Meanwhile, the S&P Global preliminary PMI series for September found the usual manufacturing weakness but the services side continues to perk along with a solid 55.4 print, well into expansionary territory.
- From our perch, we’ll be looking for weekly jobless claims to start advancing higher, and for weakening signs in the services-side of the economy, to signal that the labor market softness is beginning to impede economic growth.
- Finally, new home sales for August came in above expectations at 716 thousand annualized but that is down from an upwardly revised 751 thousand in July. New home sales are based on contract signings so it’s a timelier look at the impact of lower interest rates on sales activity. Keep in mind too that builders are typically buying down rates for purchasers to further the sales effort. Thus, while rates were declining for most of July and August, sales activity doesn’t appear to be moving materially higher. The combination of high prices and still high, but declining, mortgage rates remain a headwind for the housing market.
Jobs Plentiful Minus Jobs Hard to Get – Continues to Trend Lower Signaling More Labor Market Weakness Source: Bloomberg
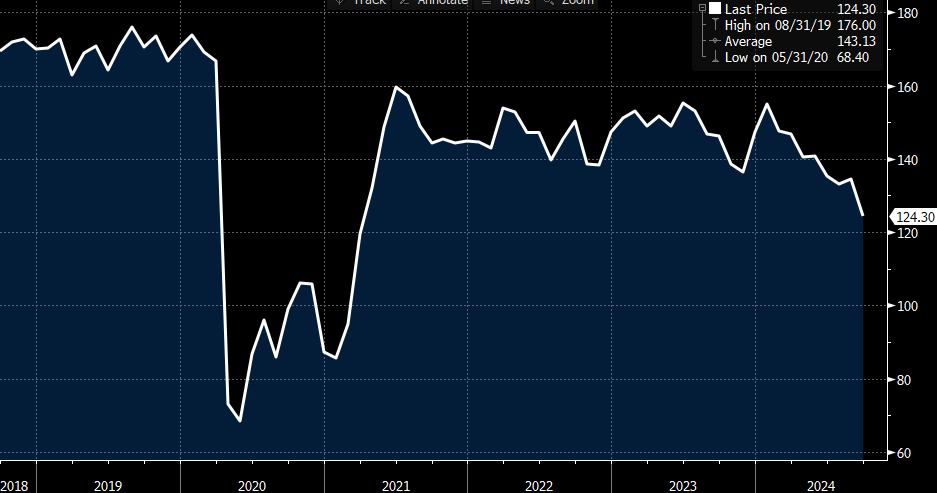
Consumer Present Situation Index – Lowest Since 2021

Securities offered through the SouthState | DuncanWilliams 1) are not FDIC insured, 2) not guaranteed by any bank, and 3) may lose value including a possible loss of principal invested. SouthState | DuncanWilliams does not provide legal or tax advice. Recipients should consult with their own legal or tax professionals prior to making any decision with a legal or tax consequence. The information contained in the summary was obtained from various sources that SouthState | DuncanWilliams believes to be reliable, but we do not guarantee its accuracy or completeness. The information contained in the summary speaks only to the dates shown and is subject to change with notice. This summary is for informational purposes only and is not intended to provide a recommendation with respect to any security. In addition, this summary does not take into account the financial position or investment objectives of any specific investor. This is not an offer to sell or buy any securities product, nor should it be construed as investment advice or investment recommendations.
