ISM Services for July also Hints at Slowing Economy
- Treasury yields are listlessly ticking higher but it’s more about flows and positioning for the 10yr auction than any new catalyst. The Treasury will sell $42 billion in 10yr notes today and that should keep yields on a short leash until past the 1pm ET announcement. Meanwhile, President Trump has said he will announce a replacement for resigning governor Adriana Kugler this week. The Kevins (Hassett and Warsh) remain favorites but Waller and Bowman’s recent FOMC dissents have them in the running as well for the future Chairman position. As someone who has spoken intelligently about policy from both a hawkish and dovish perspective, we would give Waller the nod there. Currently, the 10yr Treasury is yielding 4.22%, up 3bps on the day, while the 2yr note yields 3.72%, up 1bp in early trading.
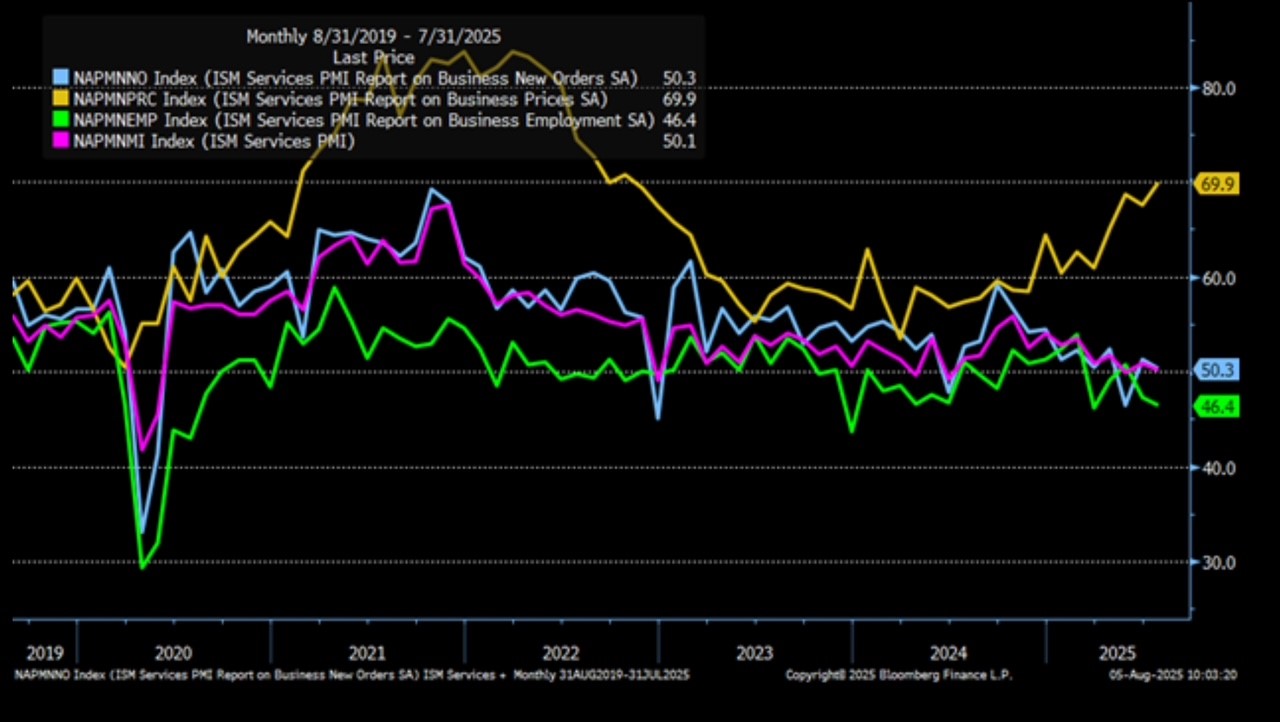
- A somewhat disappointing ISM Services Index for July added to the post-payrolls angst that the economy may be slipping faster than previously thought. The headline was 50.1%, 0.7% points lower than the June figure of 50.8% but in expansion territory for the second month in a row. The New Orders Index also remained in expansion territory in July, but barely, recording a reading of 50.3%, a drop of 1% from the June figure of 51.3%.
- The Employment Index was in contraction territory for the second month in a row and the fourth time in the last five months; the reading of 46.4% is 0.8% lower than the 47.2% in June. The Prices Paid Index registered 69.9%, a 2.4% increase from June’s reading of 67.5%. The index has exceeded 60% for eight straight months, with July’s reading the highest since October 2022 (70.7 percent). The case for higher prices is firmly in place beyond just the goods category. As the Fed ponders a September rate cut that increasing price pattern will weigh on their decision. It won’t stop them from cutting, but it may limit any thought of an outsized 50bps cut.
- In addition, the most recent global trade figures reflect tariff tension. The New Exports Index fell 3.2% in July and the New Imports Index declined 5.8%. Both moved from expansion to contraction, providing another signal that tariff tensions are impacting global trade. Most respondents’ remarks centered on the uncertainty regarding tariffs and trade policy as both increasing costs and reducing visibility. A tough environment to be sure.
- Meanwhile, the New York Fed released its quarterly look at household debt. Total debt increased by $185 billion to hit $18.39 trillion in the second quarter. Mortgage balances grew by $131 billion and totaled $12.94 trillion at the end of June. Auto loan balances increased by $13 billion to reach $1.66 trillion. The pace of mortgage originations increased slightly, with $458 billion in newly originated mortgages in the second quarter. HELOC balances rose by $9 billion to $411 billion, representing the thirteenth consecutive quarterly increase. Student loan balances edged up by $7 billion and stood at $1.64 trillion, with student loans seeing another uptick in the rate at which balances moved from current to delinquent due to the resumption of reporting of delinquent student loans. Aggregate delinquency rates remained elevated in the second quarter, with 4.4% of outstanding debt in some stage of delinquency.
- It’s of note that HELOC balances are continuing to be a larger source of funding for the consumer. We expected that as savings rates ran down in 2023 and continued last year. With the Fed commencing rate cuts last fall, and home values peaking, borrowers started to rediscover the home ATM that was so popular before the Great Financial Crisis (and no, we’re not predicting that excess borrowing to happen again, at least not yet). The rate cutting pause in 2025 probably restrained some tapping of equity, but now that cuts are on the horizon, we expect this form of borrowing to climb again, especially when cuts become a reality. Once again, don’t bet against the American consumer to find ways to finance their consumption!
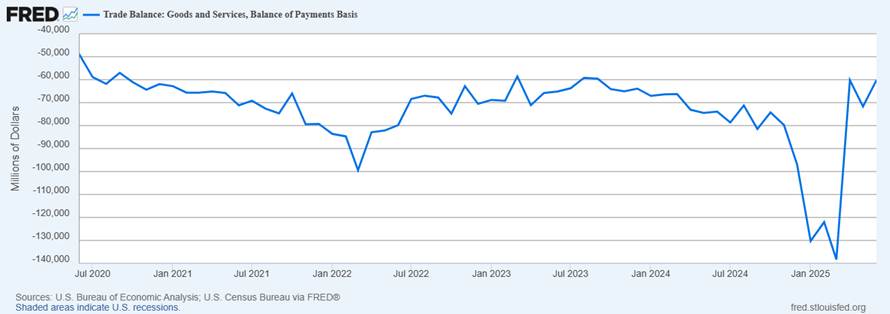
- Meanwhile, the June Trade Balance numbers were a bit better for the month. Exports were $277.3 billion, $1.3 billion less than May while imports were $337.5 billion, $12.8 billion less than May resulting in a skinnier trade deficit of -$60.2 billion vs. -$71.5 billion in May. The decrease in the goods and services deficit reflected a decrease in the goods deficit of $11.4 billion to $85.9 billion and an increase in the services surplus of $0.1 billion to $25.7 billion. Year-to-date, the goods and services deficit has increased $161.5 billion, or 38.3%, from the same period in 2024. Exports increased $82.2 billion or 5.2%. Imports increased $243.7 billion or 12.1%, much of that in the first quarter pre-tariff surge.
- It’s never to early to look toward next week’s CPI numbers for July. While we think a modest increase in inflation is in the cards, we don’t think it will keep the Fed from cutting in September. Early expectations are for headline CPI to increase 0.2% MoM and 2.8% YoY vs. 0.3% and 2.7% in June, respectively. Core CPI is expected to increase 0.3% MoM vs. 0.2% in May and pushing the YoY to 3.0% from 2.9%. Keep in mind, the Fed will get the August CPI inflation data prior to the September FOMC meeting, but absent an upside surprise the momentum to cut off the weak jobs report will likely keep a 25bps rate cut a fait accompli.
Not Much Good News in Latest ISM Services Index for July
If you Squint, You See HELOC Balances Increasing – When Fed Cuts Resume Expect More Tapping this Credit Source
Trade & Services Deficit Improves to 2023 Levels from Pre-Tariff Import Surge

Securities offered through the SouthState | DuncanWilliams 1) are not FDIC insured, 2) not guaranteed by any bank, and 3) may lose value including a possible loss of principal invested. SouthState | DuncanWilliams does not provide legal or tax advice. Recipients should consult with their own legal or tax professionals prior to making any decision with a legal or tax consequence. The information contained in the summary was obtained from various sources that SouthState | DuncanWilliams believes to be reliable, but we do not guarantee its accuracy or completeness. The information contained in the summary speaks only to the dates shown and is subject to change with notice. This summary is for informational purposes only and is not intended to provide a recommendation with respect to any security. In addition, this summary does not take into account the financial position or investment objectives of any specific investor. This is not an offer to sell or buy any securities product, nor should it be construed as investment advice or investment recommendations.
