Finally, We Have a CPI Report!

- Treasuries are waffling around unchanged levels this morning with equities heading higher on the back of a delayed but better-than-expected September CPI report. The cooler inflation numbers seal a rate cut next week and pave the way for another in December. The report was about all the Fed could ask for, but the hawks will still point to 3.0% YoY levels vs. the 2.0% target. Currently, the 10yr Treasury is yielding 4.00%, up 1bp on the day, while the 2yr note yields 3.47%, down 1bp in early trading.
- The September CPI report, delayed for more than two weeks, was finally released this morning and without further ado let’s get to the numbers. Core CPI was up 0.2% (0.23 unrounded) vs. 0.3% expected and 0.3% in August. The YoY rate dipped a tenth to 3.0% vs. 3.1% expected. Meanwhile, overall CPI printed at 0.3% (0.31% unrounded), below the 0.4% expectation and August results, and while the YoY rate rose from 2.9% to 3.0% it was a tenth less than the 3.1% expectation.
- Digging into the details, core service eased from August results. Recall, this is the ”sticky” component of inflation that Powell has focused on while waiting for Owner’s Equivalent Rent (OER) to roll over. Core services dipped to 0.24% MoM vs. 0.35% in August and 0.48% in July. YoY the rate is 3.2% annually. The “stickiness” of this non-tariff sector had been an area of concern, but it’s tracking lower since July and that will play to the doves advantage in pressing for a rate cut next week or in December.
- Speaking of OER, it printed at 0.1% (0.137% unrounded) after a steamy 0.38% print in August and is the lowest since early 2021. When July’s result dipped into the 0.28% level, hopes were that this single largest piece of CPI (27% weighting) was back within the 0.20% – 0.30% range that prevailed pre-covid. The bounce in August appears to be just that and now this metric looks to finally be back into the pre-pandemic range, if not below. Thus, after many false starts, it looks as if OER will help to bail out higher goods and service prices.
- Core goods prices slowed their increase in September at 0.22% MoM vs. 0.28% in August revealing that tariff costs are moderating their impact on prices. The YoY rate held at 1.5% while core services eased to 3.5% (see the YoY graph below). The consumer is likely to continue to see higher goods prices in the months ahead, but those increases should be modest if the September results portend a trend.
- This report is about all the Fed could hope for and will keep them firmly in cutting mode next week, and it also greases the skids for another 25bps cut in December. The hawks will still point to 3.0% YoY levels being 100bps above target but the fear of tariffs pushing those YoY levels higher appear overdone if subsequent months mimic September.
- One area that heretofore has been absent in the economic discussion is around the area of credit quality. The absence of credit concerns has allowed the Fed freedom to focus on its dual mandate of price stability and full employment but that may begin to change in the coming months. While we’ve heard recently of credit losses around Tricolor and First Brands, another subprime lender has gone under. PrimaLend Capital Partners filed for bankruptcy after months of negotiations with creditors. It’s yet another sign of stress in a sector catering to low-income consumers. PrimaLend’s filing comes weeks after the bankruptcy of another “buy here, pay here” dealership, Tricolor Holdings, as lower-income Americans fall behind on car loans at the highest rate in decades.
- The percentage of subprime borrowers – those with credit scores below 670 – who are at least 60 days late on their car loans has doubled since 2021 to 6.43%, according to Fitch Ratings. That’s worse than during the past three recessions – during the Covid pandemic, the Great Recession or the dotcom bust. America’s current subprime delinquency rate is at the second-highest level since the early 1990s. The only time it was higher: this past January. Cars are being repossessed at the highest rate since the Great Recession of 2008 and 2009 (see graph below).
- We recall the early days of the Great Financial Crisis when lenders confidently stated, “they didn’t do sub-prime loans” only to be quickly swept up in the gathering credit storm. We’re a long way from a repeat of that but it bears watching and could influence the Fed to cut despite sticky inflation numbers in 2026.
CPI and Core CPI (YoY) – Beat Expectations at 3.0%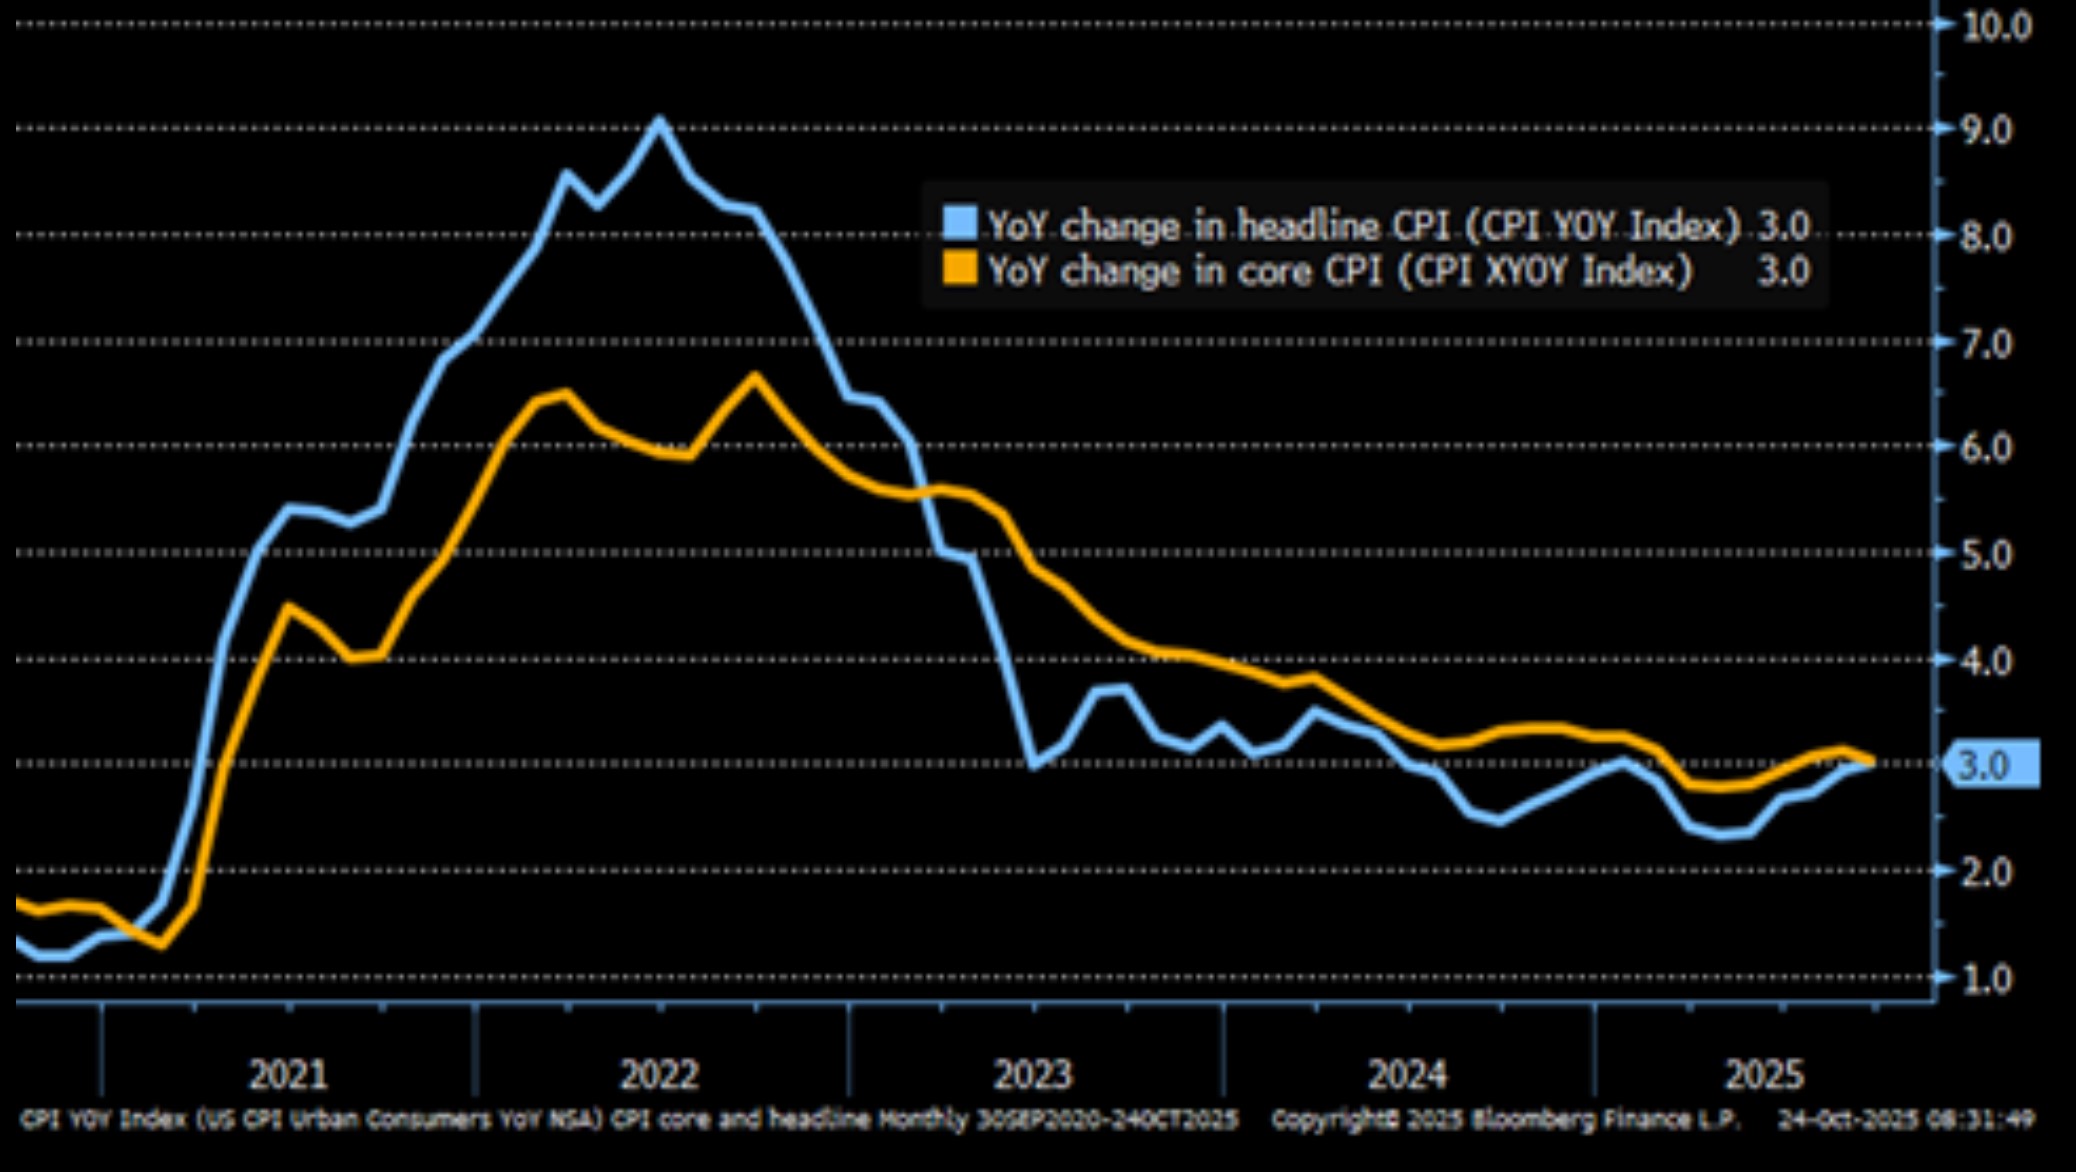
Owners Equivalent Rent (MoM) – Lowest Since 2021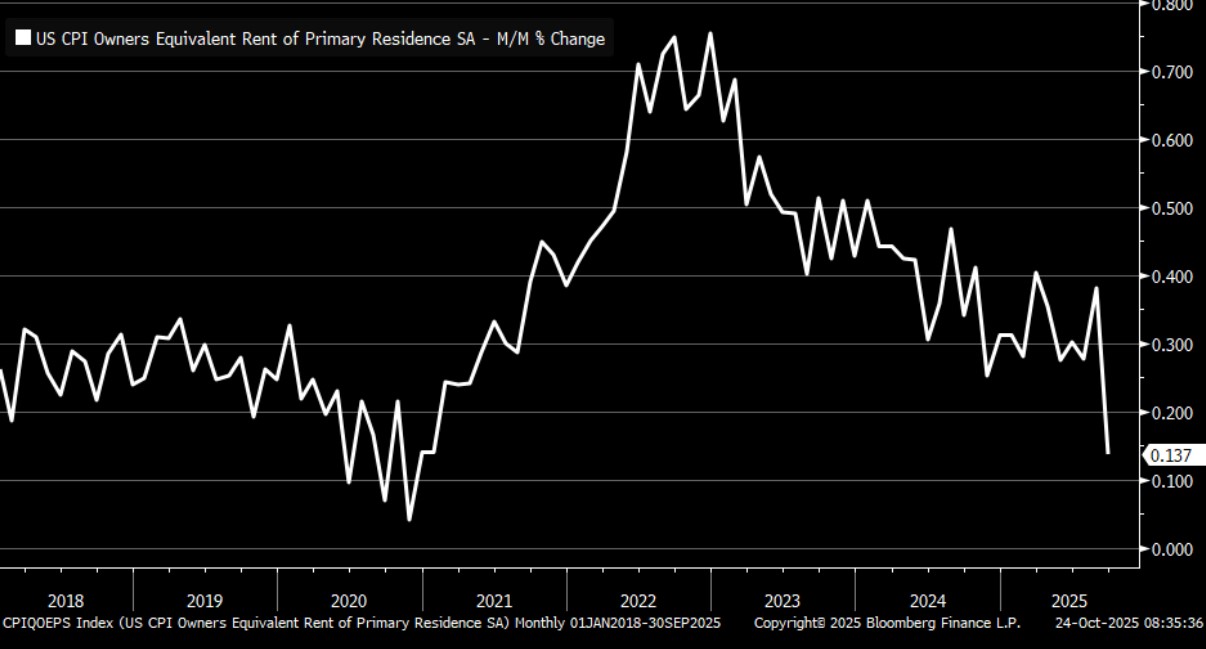
Core Goods and Core Services (YoY) – Core Goods Level MoM, While Core Services Trending Lower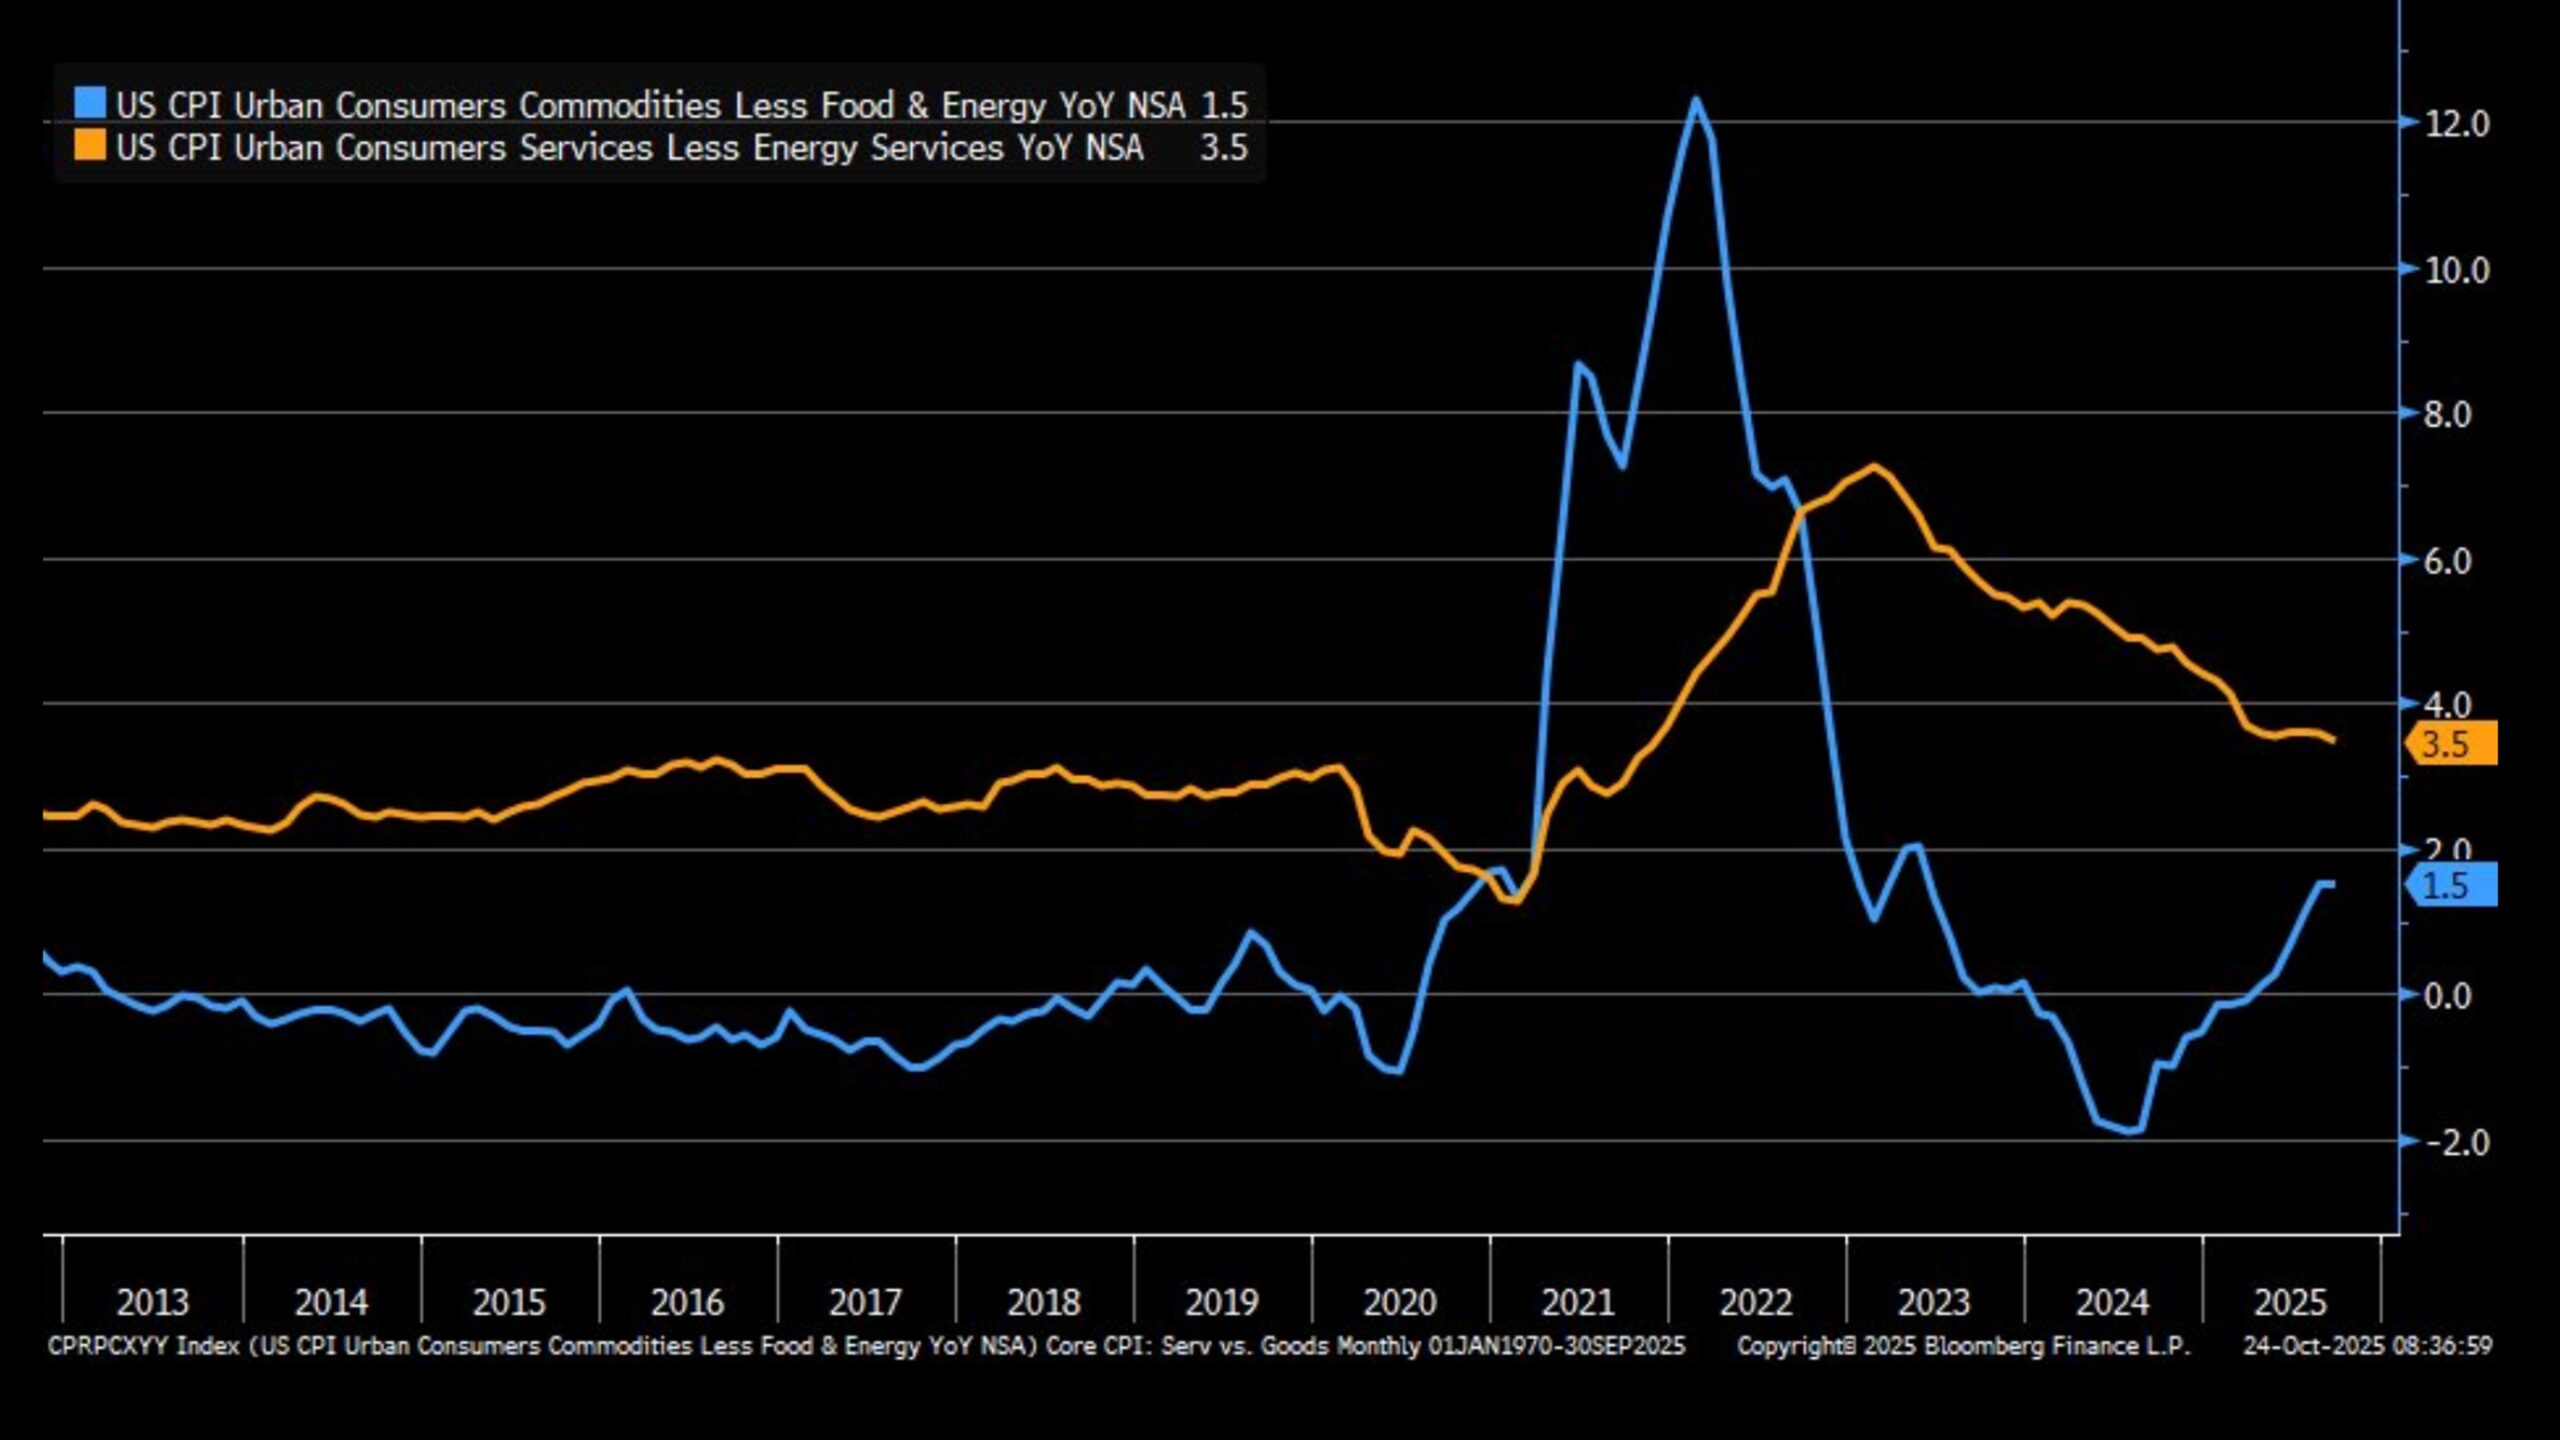
Subprime Car Loan Borrowers – Struggling to Stay Current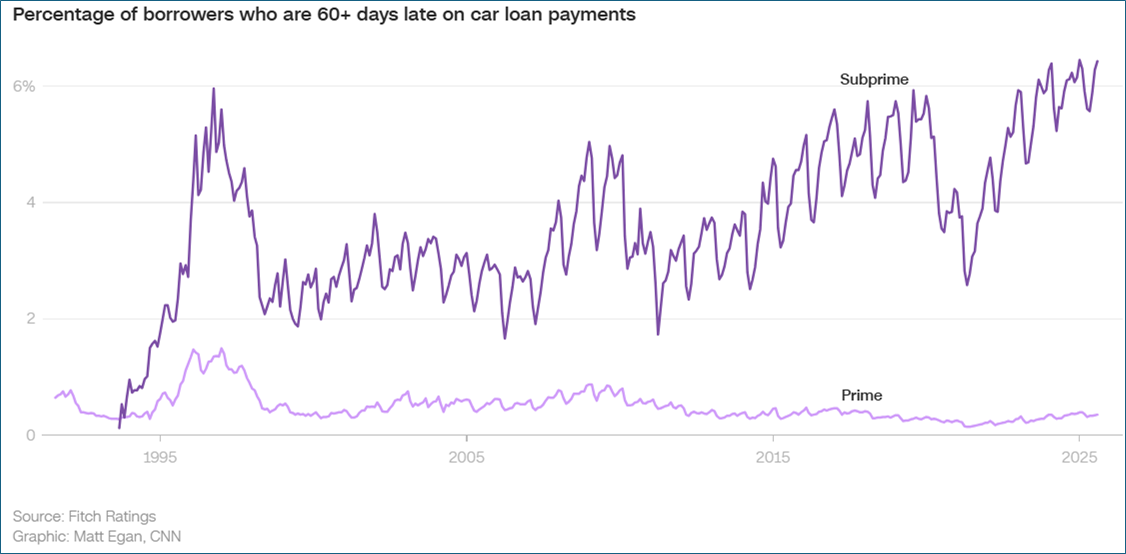
Securities offered through the SouthState | DuncanWilliams 1) are not FDIC insured, 2) not guaranteed by any bank, and 3) may lose value including a possible loss of principal invested. SouthState | DuncanWilliams does not provide legal or tax advice. Recipients should consult with their own legal or tax professionals prior to making any decision with a legal or tax consequence. The information contained in the summary was obtained from various sources that SouthState | DuncanWilliams believes to be reliable, but we do not guarantee its accuracy or completeness. The information contained in the summary speaks only to the dates shown and is subject to change with notice. This summary is for informational purposes only and is not intended to provide a recommendation with respect to any security. In addition, this summary does not take into account the financial position or investment objectives of any specific investor. This is not an offer to sell or buy any securities product, nor should it be construed as investment advice or investment recommendations.