Examining Bond Portfolio Trends: Fourth Quarter 2023

Examining Bond Portfolio Trends: Fourth Quarter 2023
Beginning in May 2012, we started tracking portfolio trends of our bond accounting customers here at SouthState|DuncanWilliams. At present, we account for over 130 client portfolios with a combined book value of $14.2 billion (not including SouthState Bank’s portfolio), or $109 million on average per portfolio. Twelve months earlier, the average portfolio size was $107 million which represents a 2% year-over-year increase. This percentage increase has been trending down for the last two years as higher fed funds rates compete with investments. Average portfolio size peaked at $111 million in November.
The Fed’s hawkish tone had been a consistent theme for nearly two years, but the December FOMC meeting offered a bit of a reprieve. In the Fed’s December forecast, they foresaw no more rate hikes and a total of three 25bps rate cuts in 2024. While still not as aggressive as the market’s nearly 150bps in rate cutting expectations, the so-called dovish pivot contributed to the solid bond rally in both November and December. The question now is when will the first rate cut happen? The fed funds futures market gives it more than a 70% probability for the March meeting, but with decent labor market growth, and inflation still above 3%, we believe the Fed could wait until the June meeting.
Since the end of the third quarter, the higher yield momentum that prevailed through most of 2023 finally slowed with yields peaking around mid-October. The combination of softer inflation readings, slowing employment gains, and less hawkish Fed rhetoric contributed to lower yields through the balance of the quarter, especially in November and December. In December the rally got a boost from the FOMC meeting where the forecasts and Fed Chair Powell’s dovish comments contributed to the sense that rate hikes were done and it was only a matter of time before rate cuts would commence. With that backdrop, let’s turn our attention to the changes in portfolio allocation during the past year.
Changes in Portfolio Allocations
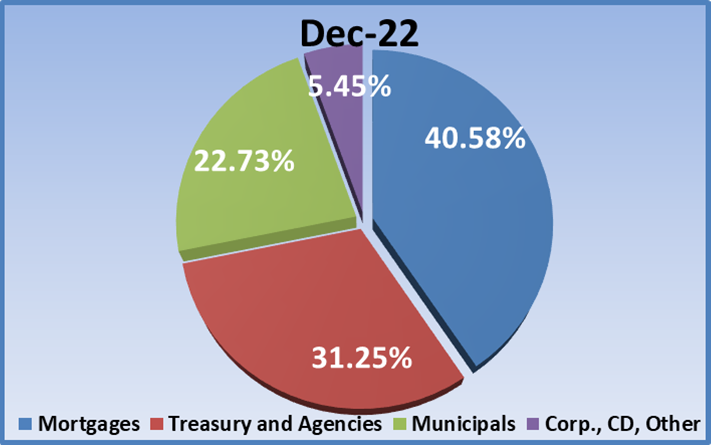
Let’s begin our portfolio review by revisiting allocations a year ago as shown in the pie chart below. The MBS/CMO sector comprised 41% of the portfolio, municipal allocations stood at 23%, Agency/Treasury investments were 31%, and the “Other” category (CDs, corporates and other floaters) 5.5%.
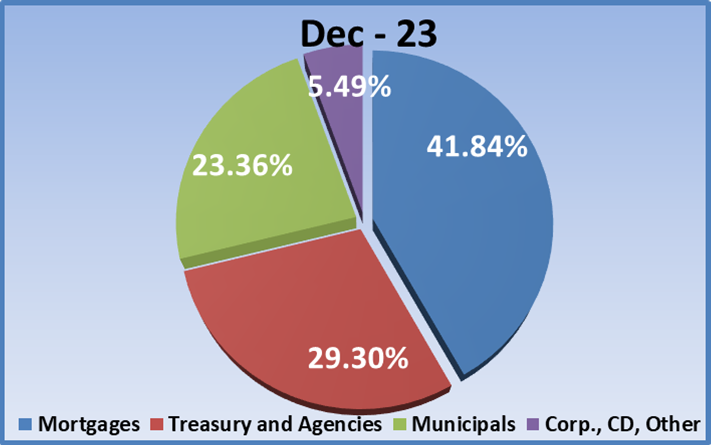
Fast forward one year to December 31, 2023. The MBS/CMO sector comprises 42% of the portfolio, essentially unchanged from last year. This at least stops the experience of the prior six quarters of declining MBS allocations. Previous to the hiking cycle, MBS tended to lead new investments.
The decrease in municipal investments that had been a feature over the last year plus stopped this quarter with 23% in the municipal sector (16.0% tax-free, 7.3% taxable) which matches the year ago level. The stable investment allocation is an improvement over the run-off that had a been a feature once the hiking cycle started in March 2022.
The Agency/Treasury sector had been the one area that experienced increased allocations during the hiking cycle but this quarter actually saw a decline from 31% a year ago to 29% this year as the MBS and muni sectors finally started to entice investors back to those sectors. The “Other” category was essentially unchanged at 5.45% a year ago to 5.49% with corporate bonds constituting more than 80% of the category at 4.4%.
Changes in Portfolio Performance
Now let’s look at portfolio performance trends. The graph below tracks average portfolio tax-equivalent book yield, duration, and unrealized gain/(loss) as a percent of book value. It also tracks 10-year Treasury yields and average portfolio size over the last two years.
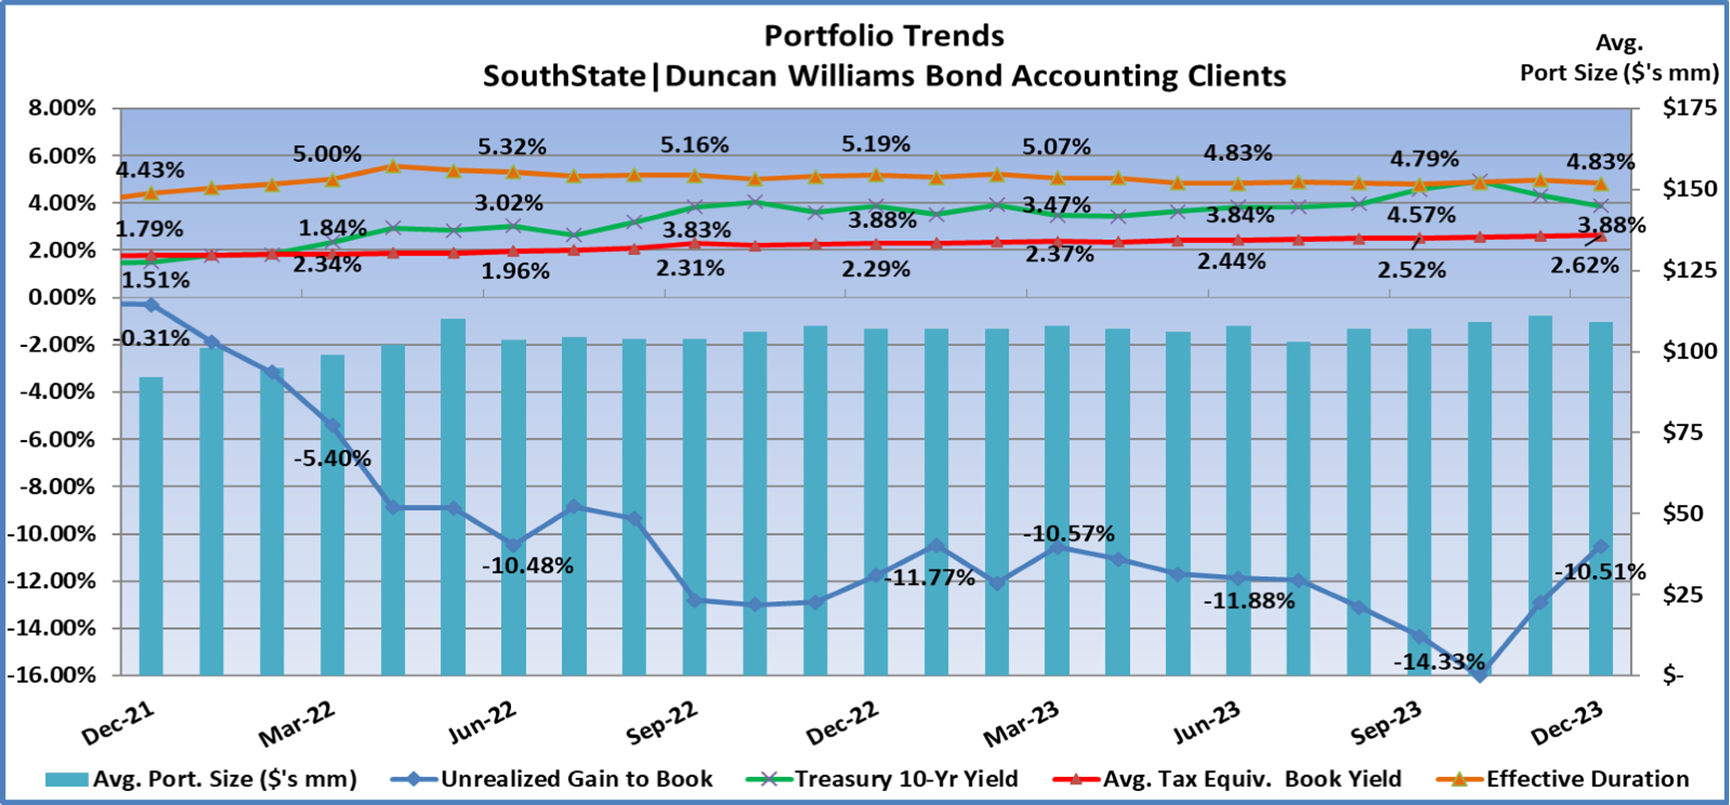
Portfolio yields started the year at 2.29% (red line). Yields slowly rose through the year as reinvestments were made on higher market yields, albeit on a limited basis. In the fourth quarter yields increased 10bps to 2.62% and improved 33bps for the year. Despite the year-end rally, we expect portfolio yields to continue increasing as much lower yielding legacy bonds are reinvested at higher market yields.
As shown, 10-year Treasury yields (green line) began the fourth quarter at 4.57% and peaked mid-October at 4.99%, a new cycle high. However, with softer inflation and employment reports, and a dovish pivot by the Fed in December, 10yr yields spent the rest of the quarter falling, ending the year at 3.88%, or down 69bps for the quarter and down 111bps from the mid-October cycle high.
Durations began the year at 5.19 years and dipped during the first three quarters to 4.79 years as investments focused on shorter-duration securities. Despite lower yields during the fourth quarter, portfolio duration backed up ever-so-slightly to 4.83 years, same as the second quarter, as some investors started to dabble again in longer duration investments.
Combined with the slight decrease in duration, and the much larger decrease in interest rates during the quarter, market values finally improved. The fourth quarter saw unrealized losses decrease from –
Portfolio Purchases During the Fourth Quarter 2023
Finally, new investments in the fourth quarter increased modestly from $494 million in the third quarter to $530 million, or $4.1 million on average per portfolio. Fourth quarter investments represented the highest quarterly total this year. These investments were led for the eighth straight quarter by the Treasury/agency sector with purchases comprising 41% of the $530 million total (36% Treasuries, 5% agency securities). The 41% Treasury/agency purchases exceeded the legacy total of 29%. The MBS/CMO sector followed with purchases equaling 35% of the total (28% in MBS and 7% in CMOs). The 35% MBS/CMO allocation compares to a legacy total of 42%. The municipal sector followed at 4% of total purchases (3.3% tax-free, 0.7% taxable). The 4% in muni purchases compares to a 23% legacy muni allocation.
Average tax-equivalent book yield for fourth quarter purchases was 5.71% versus 5.43% in the prior quarter. The average effective duration was 1.98 years versus 1.99 years in the prior quarter. Negative convexity was –0.34 versus –0.27 in the prior quarter. Compare those figures to the legacy portfolio book yield of 2.62% and effective duration of 4.83 years. It’s interesting to note that the purchases ended the quarter with an unrealized gain of 1.5% of book, reflecting the fierce rally during November and December. That’s the first quarterly unrealized gain since the hiking cycle began in March 2022.
We will update this data again in April to track how allocations and performance characteristics trended in the new year.
Securities offered through the SouthState | DuncanWilliams 1) are not FDIC insured, 2) not guaranteed by any bank, and 3) may lose value including a possible loss of principal invested. SouthState | DuncanWilliams does not provide legal or tax advice. Recipients should consult with their own legal or tax professionals prior to making any decision with a legal or tax consequence. The information contained in the summary was obtained from various sources that SouthState | DuncanWilliams believes to be reliable, but we do not guarantee its accuracy or completeness. The information contained in the summary speaks only to the dates shown and is subject to change with notice. This summary is for informational purposes only and is not intended to provide a recommendation with respect to any security. In addition, this summary does not take into account the financial position or investment objectives of any specific investor. This is not an offer to sell or buy any securities product, nor should it be construed as investment advice or investment recommendations.