Bond Portfolio Trends: Third Quarter 2025

Bond Portfolio Trends: Third Quarter 2025
Background
Beginning in May 2012, we started tracking portfolio trends of our bond accounting customers here at SouthState|DuncanWilliams. At present, we account for over 130 client portfolios with a combined book value of $12.4 billion (not including SouthState Bank’s portfolio), or $96 million on average per portfolio. Twelve months earlier, the average portfolio size was $105 million, an 8.6% decrease over the year. That decline is similar to recent quarterly results. Average portfolio size peaked at $111 million in November 2023.
Third Quarter Market Observations
- The third quarter of 2025 was characterized by a gathering belief that inflation risks from tariffs would not be as bad as feared in the first quarter and that fed into expectations the Fed would resume rate-cutting at its September FOMC meeting. Yields peaked early in the quarter before the ebbing of inflation fears and that downtrend gathered momentum after Fed Chair Powell’s dovish speech at the Jackson Hole central bank symposium in late August.
- The rally continued into the September 17th FOMC rate cut decision before consolidating towards quarter end as inflation results continued to be “sticky”. That gave Treasury investors second thoughts about trying to rally the 10yr Treasury to a sub 4% yield. That attempt will have to wait for the fourth quarter, but futures expectations are calling for the Fed to cut again on October 29th and December 10th, the final FOMC meeting of 2025, so we suspect a sub 4% 10yr is still imminently achievable.
- During the quarter, the 10yr Treasury yield ended 8bps lower reflecting the push and pull of slower growth, a resumption of rate cuts, but little improvement in inflation. Meanwhile, the 2yr Treasury finished the quarter 11bps lower, as the September rate cut and slower growth proved more impactful to short-term yields than lingering inflation fears. With that backdrop, let’s turn our attention to changes in portfolio allocations during the past year.
Changes in Portfolio Allocations
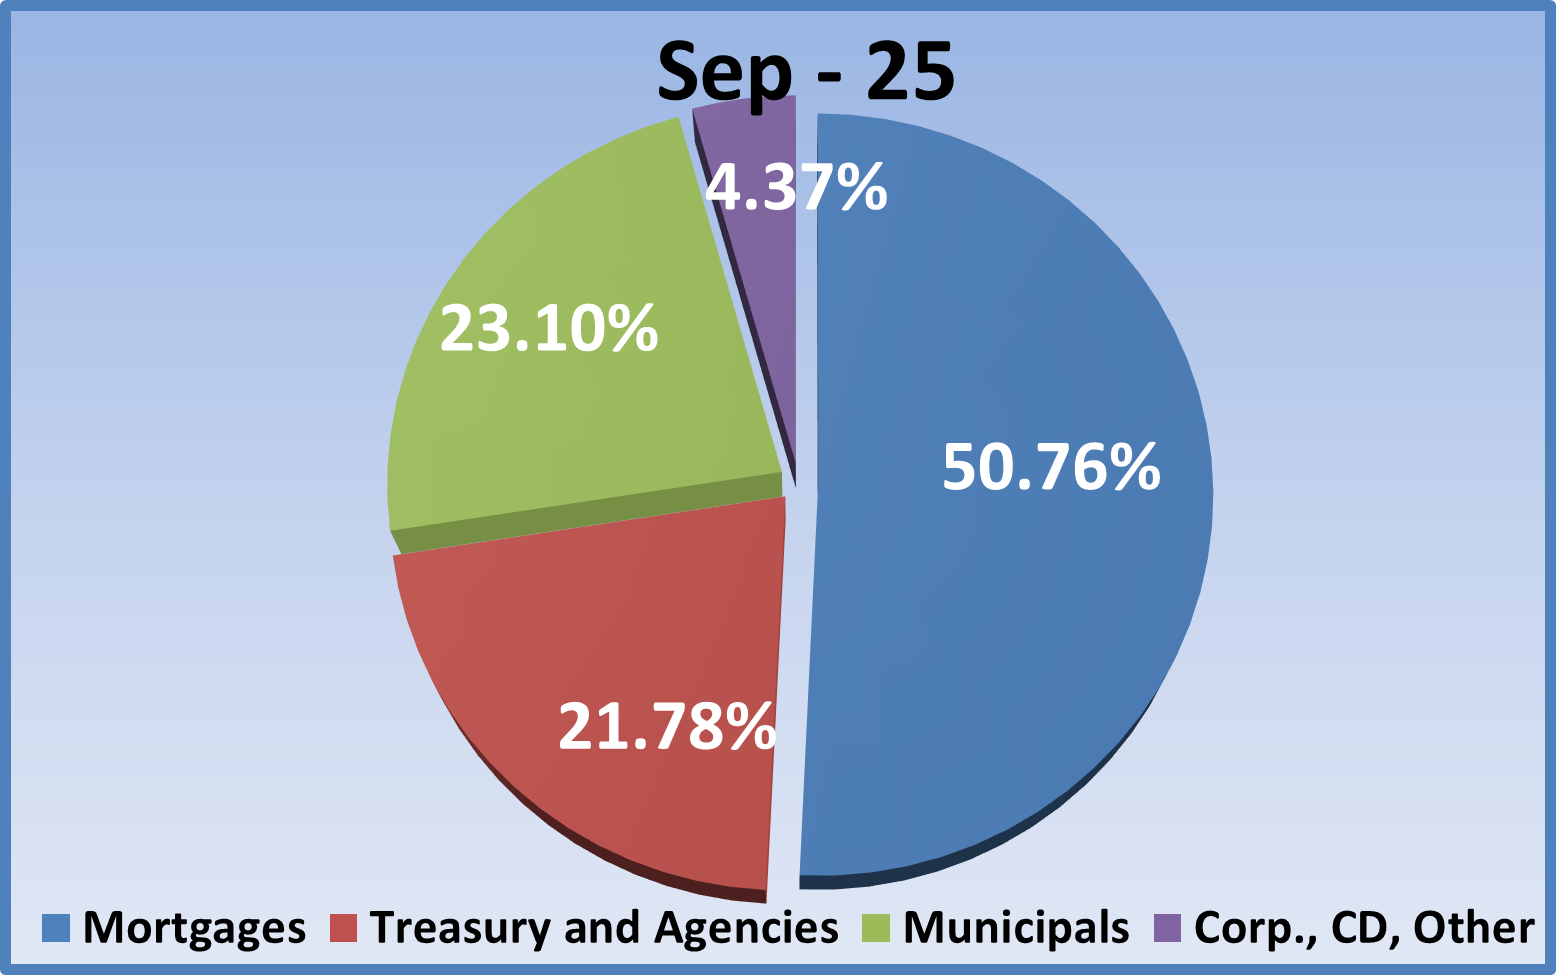
- Let’s begin our portfolio review by revisiting allocations a year ago as shown in the pie chart below. The MBS/CMO sector comprised 43% of the portfolio, Agency/Treasury investments were 28%, municipal allocations stood at 24%, and the “Other” category (CDs, corporates, and other floaters) 4.7%.
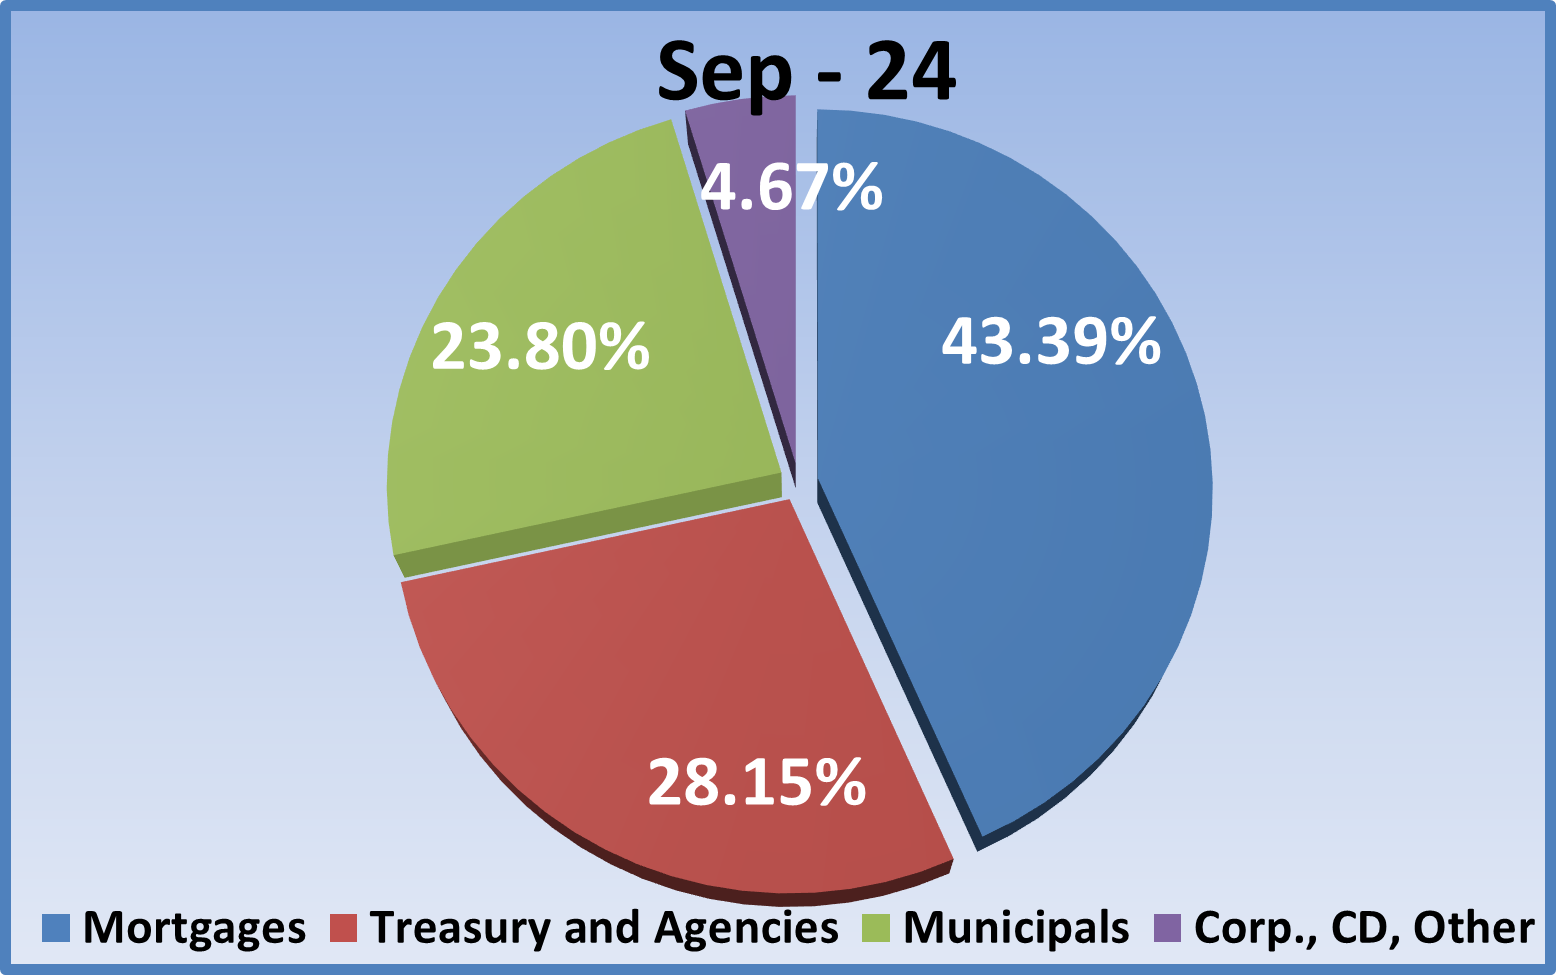
- Fast forward one year to September 30, 2025. The MBS/CMO sector comprised 51% of the portfolio, a solid 8% increase from last year. This repeats the experience of the past year which halted a prior multi-year trend of declining MBS allocations. Previous to the Fed’s rate hiking cycle begun in 2022, MBS tended to lead portfolio investments by a wide margin, close to 50% of total allocations, and as you can see, we are finally back to that level again.
- The Agency/Treasury sector had been the one sector that experienced increased allocations during the hiking cycle, but for the eighth straight quarter allocations declined from 28.2% a year ago to 21.8%, a 6.4% decline as the MBS sector continued to entice investors back to those traditionally leading sectors. The “Other” category was slightly smaller at 4.4% versus 4.7% a year ago with corporate bonds constituting more than 80% of the sector.
- The decrease in municipal investments that had been a feature for much of 2023 stopped in the fourth quarter of that year and that modest increase in allocation continued throughout 2024. During this year, additional investment has slowed again as investors shifted focus to MBS over municipal securities, perhaps due to duration concerns.
Changes in Portfolio Performance
Now let’s look at portfolio performance trends. The graph below tracks average portfolio tax-equivalent book yield, duration, and unrealized gain/(loss) as a percent of book value. It also tracks 10-year Treasury yields and average portfolio size over the last two years.
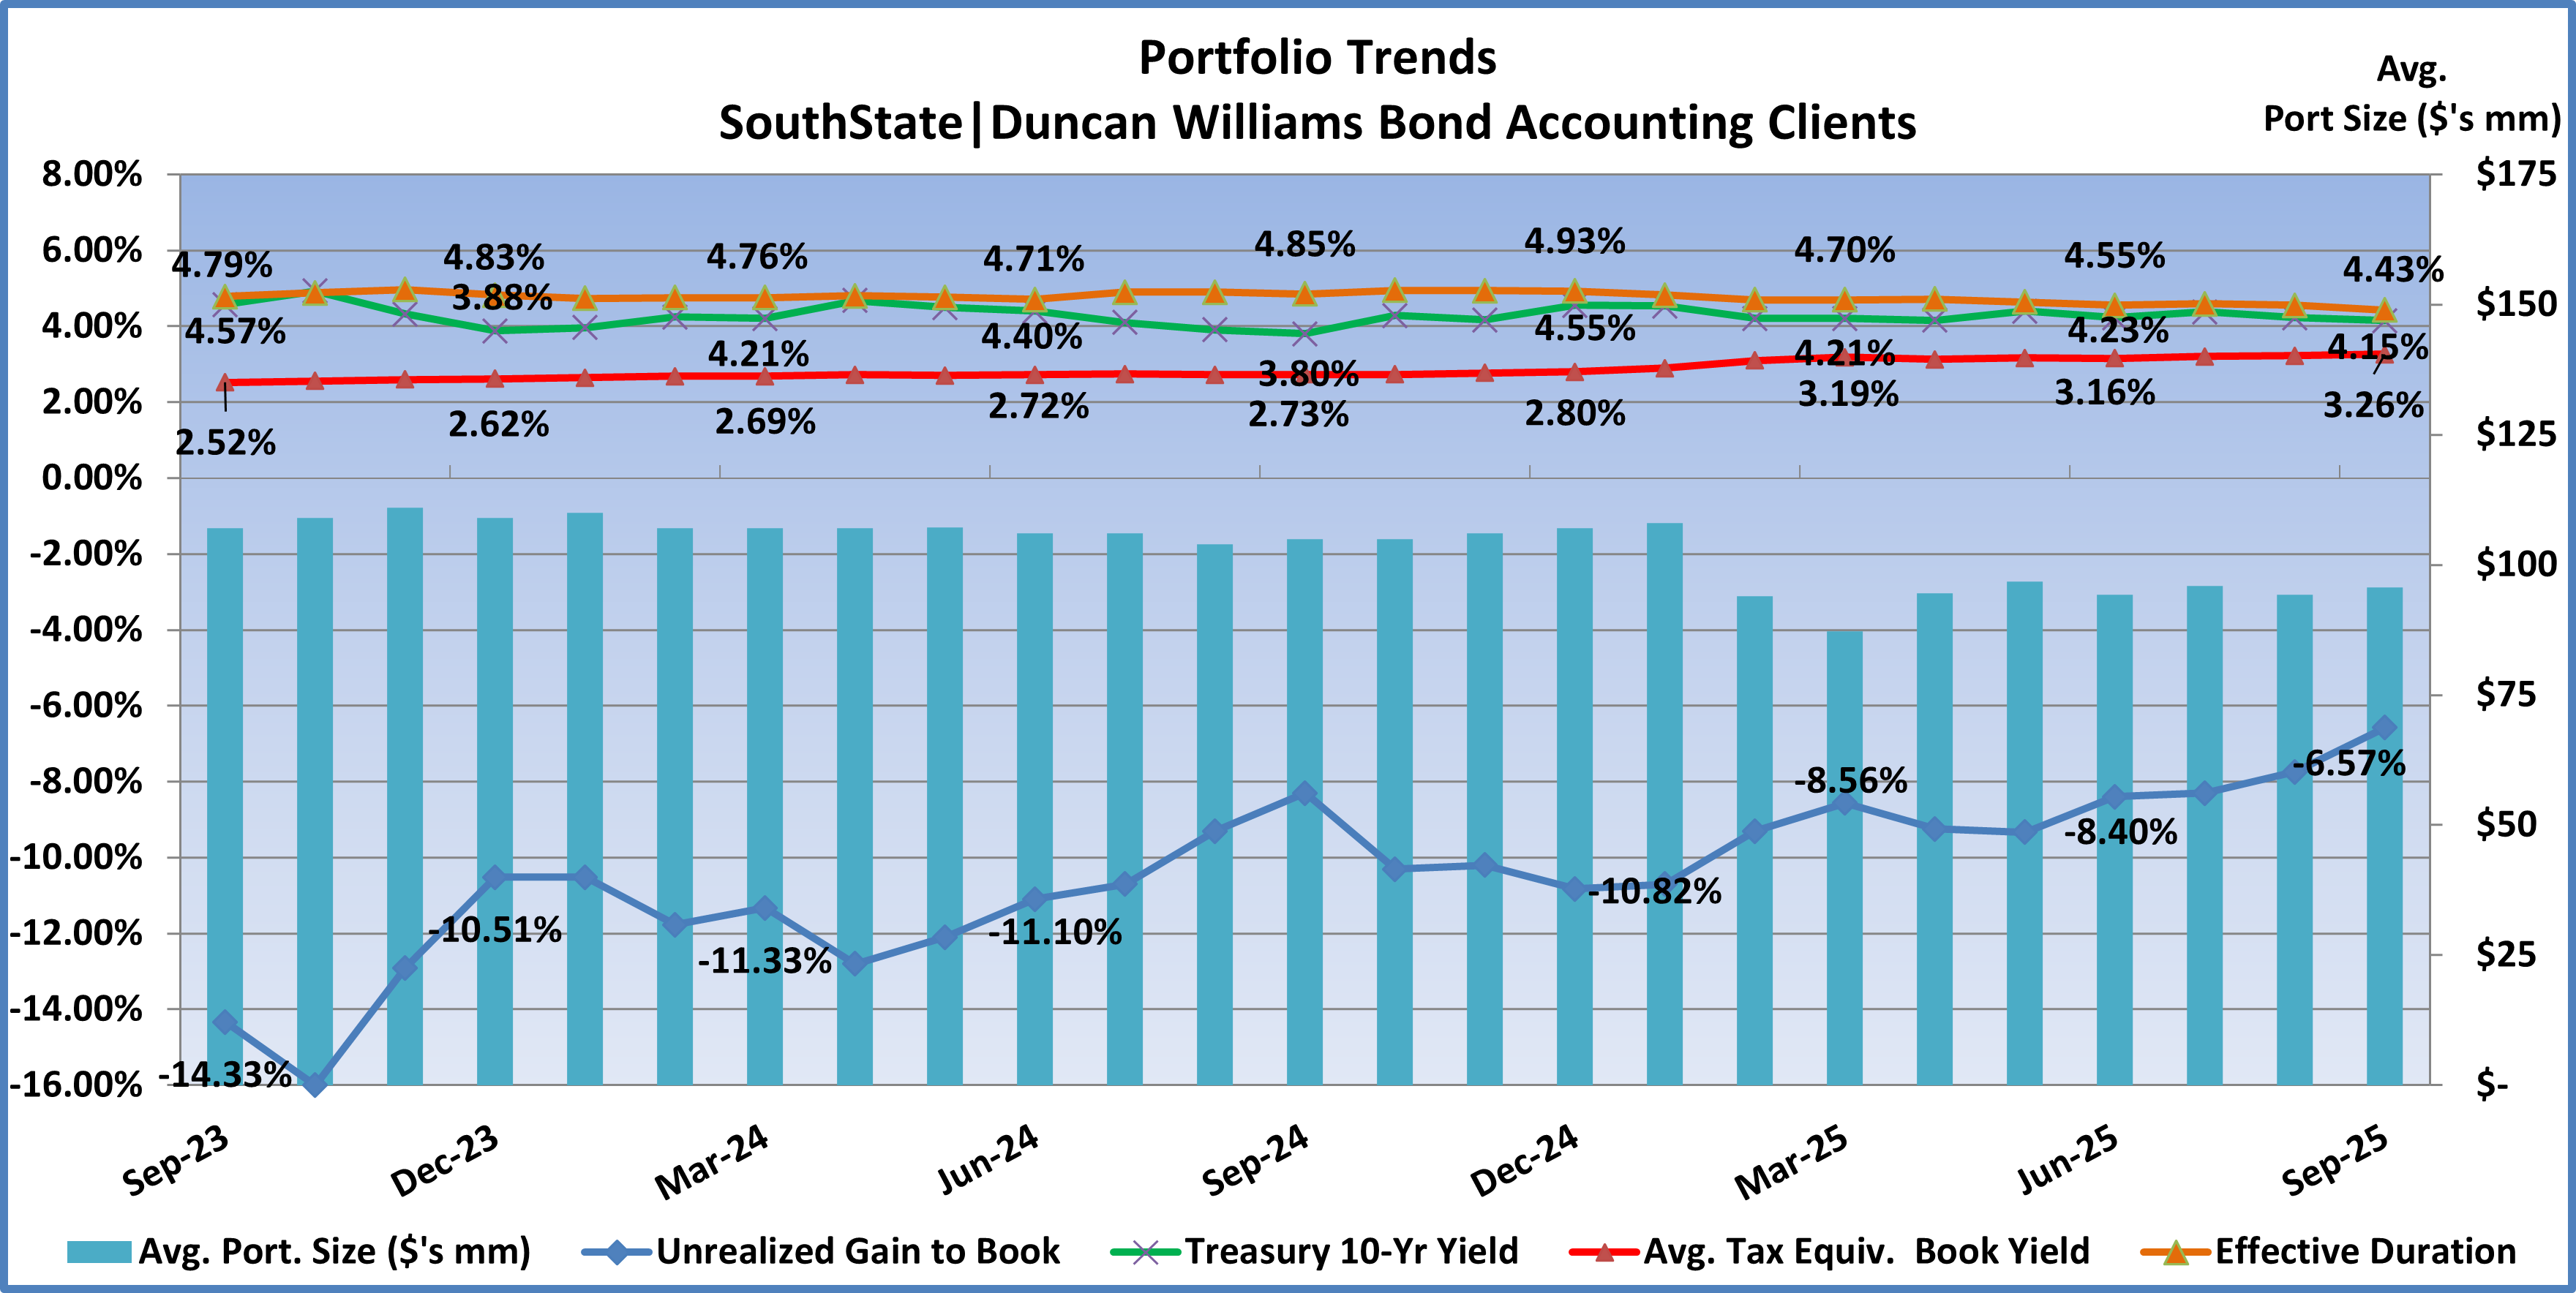
- Portfolio yields averaged 2.73% (red line) a year ago. Yields have risen through the year as reinvestments were made at higher market yields, albeit on a moderate basis. By the end of the second quarter, yields had increased 43bps over the year ago rate to 3.16%, and improved another 10bps during the third quarter. We had been seeing 7 to 8bps in quarterly yield improvement over the prior two years so this recent increase of more than 10bps per quarter reflects a slightly more aggressive investment allocation, perhaps as loan demand has slowed.
- 10-year Treasury yields (green line) a year ago were 3.80% and 4.55% at year-end 2024. The back-up was spurred on by thoughts of enhanced growth prospects under the newly elected Trump administration. However, reality presented investors with competing concerns over growth, higher costs via tariffs, and a resumption of Fed rate cuts which has kept yields more range bound as the 10yr yield finished the quarter at 4.15%, a modest 8bps decrease during the quarter and 40bps YTD.
- Durations a year ago averaged 4.85 years and trended higher in the fourth quarter of 2024 as higher rates slowed prepayment and call expectations, peaking at 4.93 years at year-end 2024. Durations ended the third quarter at 4.43 years as modestly lower rates and shorter-duration purchases aided the move lower during the year and quarter. The average duration is now the lowest since November 2021 and well off the 5.50 year high when rate hikes were beginning in March 2022.
- With the modest decrease in duration and interest rates during the quarter unrealized losses improved. Unrealized losses during the quarter decreased from –8.40% to –6.57% as a percent of book, that stands as the lowest unrealized loss since March 2022, when the Fed began its hiking cycle. The cycle worst remains the –16.00% unrealized loss in October 2023.
Portfolio Purchases During the Third Quarter 2025
- New investments during the quarter increased from $971 million in the second quarter to $1.3 billion, or $9.8 million on average per portfolio. By way of comparison, in the third quarter 2024, purchases totaled $645 million. So, purchases continue to accelerate which is a trend that began when the Fed shifted from rate hikes to cuts in late 2024. The run rate of purchases prior to the pandemic was approximately $1.2 billion per quarter, so this is the first quarter where purchases have finally returned to pre-pandemic levels.
- After ten straight quarters leading new allocations, the Treasury/agency sector, and the MBS/CMO/SBA category have been swapping places since the third quarter of 2024. The Treasury/agency sector moved back into the lead in the second quarter this year and that pattern continued in the third quarter. Investments in the sector accounted for 51% of total purchases (48% Treasury, 3% agency). The 51% in new purchases compares to a legacy total of 22%. The MBS/CMO/SBA sector followed with 46% of total purchases. The municipal sector was once again lapped by the top two categories with 3% of purchases, ( 2.0% tax-free, 1.0% taxable). The 3% in muni purchases compares to a 23% legacy muni allocation.
- Average tax-equivalent book yield for second quarter purchases was 4.35% vs. 4.34% the prior quarter. The average effective duration was 2.40 years versus 2.10 years in the prior quarter. So, investors earned slightly more yield vs. the second quarter but with slightly longer duration purchases but still well below the legacy portfolio duration. Compare those figures to the legacy portfolio book yield of 3.26% and effective duration of 4.43 years.
- We’ll be back in January with a review of fourth quarter performance and purchases, and a look back at the year that was.
Securities offered through the SouthState | DuncanWilliams 1) are not FDIC insured, 2) not guaranteed by any bank, and 3) may lose value including a possible loss of principal invested. SouthState | DuncanWilliams does not provide legal or tax advice. Recipients should consult with their own legal or tax professionals prior to making any decision with a legal or tax consequence. The information contained in the summary was obtained from various sources that SouthState | DuncanWilliams believes to be reliable, but we do not guarantee its accuracy or completeness. The information contained in the summary speaks only to the dates shown and is subject to change with notice. This summary is for informational purposes only and is not intended to provide a recommendation with respect to any security. In addition, this summary does not take into account the financial position or investment objectives of any specific investor. This is not an offer to sell or buy any securities product, nor should it be construed as investment advice or investment recommendations.