Bond Portfolio Trends: Third Quarter 2024

Bond Portfolio Trends: Third Quarter 2024
Background
Beginning in May 2012, we started tracking portfolio trends of our bond accounting customers here at SouthState|DuncanWilliams. At present, we account for over 130 client portfolios with a combined book value of $13.7 billion (not including SouthState Bank’s portfolio), or $105 million average per portfolio. Twelve months earlier, the average portfolio size was $107 million, a slight 2% decrease over the year. Average portfolio size peaked at $111 million in November 2023.
Third Quarter Market Observations
- The third quarter of 2024 was characterized by continued cooling in inflation numbers, and an economy and labor market that started to show tentative signs of slowing momentum. That moderation and cooler inflation numbers were enough to overcome the first quarter’s surprisingly strong inflation prints. Thus, the updated rate and economic forecast from the FOMC September meeting called for 100bps in rate cuts in 2024, up from one cut in the June forecast.
- Fed speak has welcomed the cooler inflation prints, and Chair Powell expressed increasing confidence that inflation is trending to the 2% target. He also added, in Jackson Hole in August, that the Fed “did not seek nor welcome further labor market cooling.” This was a clear signal that they had shifted attention, at least partially, from inflation to the full employment mandate. Those Jackson Hole comments were followed by a 50bps cut at the September FOMC meeting, with another 50bps in cuts forecast by year-end.
- During the quarter, yields fell as the cooler inflation and labor market data made it clear the Fed was shifting from an on hold position to moving closer to rate cuts, which they did at the September 17 FOMC meeting. Thus, 10yr yields ended the quarter 54bps lower and the 2yr Treasury finished the quarter 107bps lower, as rate cut anticipation grew. With that backdrop, let’s turn our attention to changes in portfolio allocations during the past year.
Changes in Portfolio Allocations
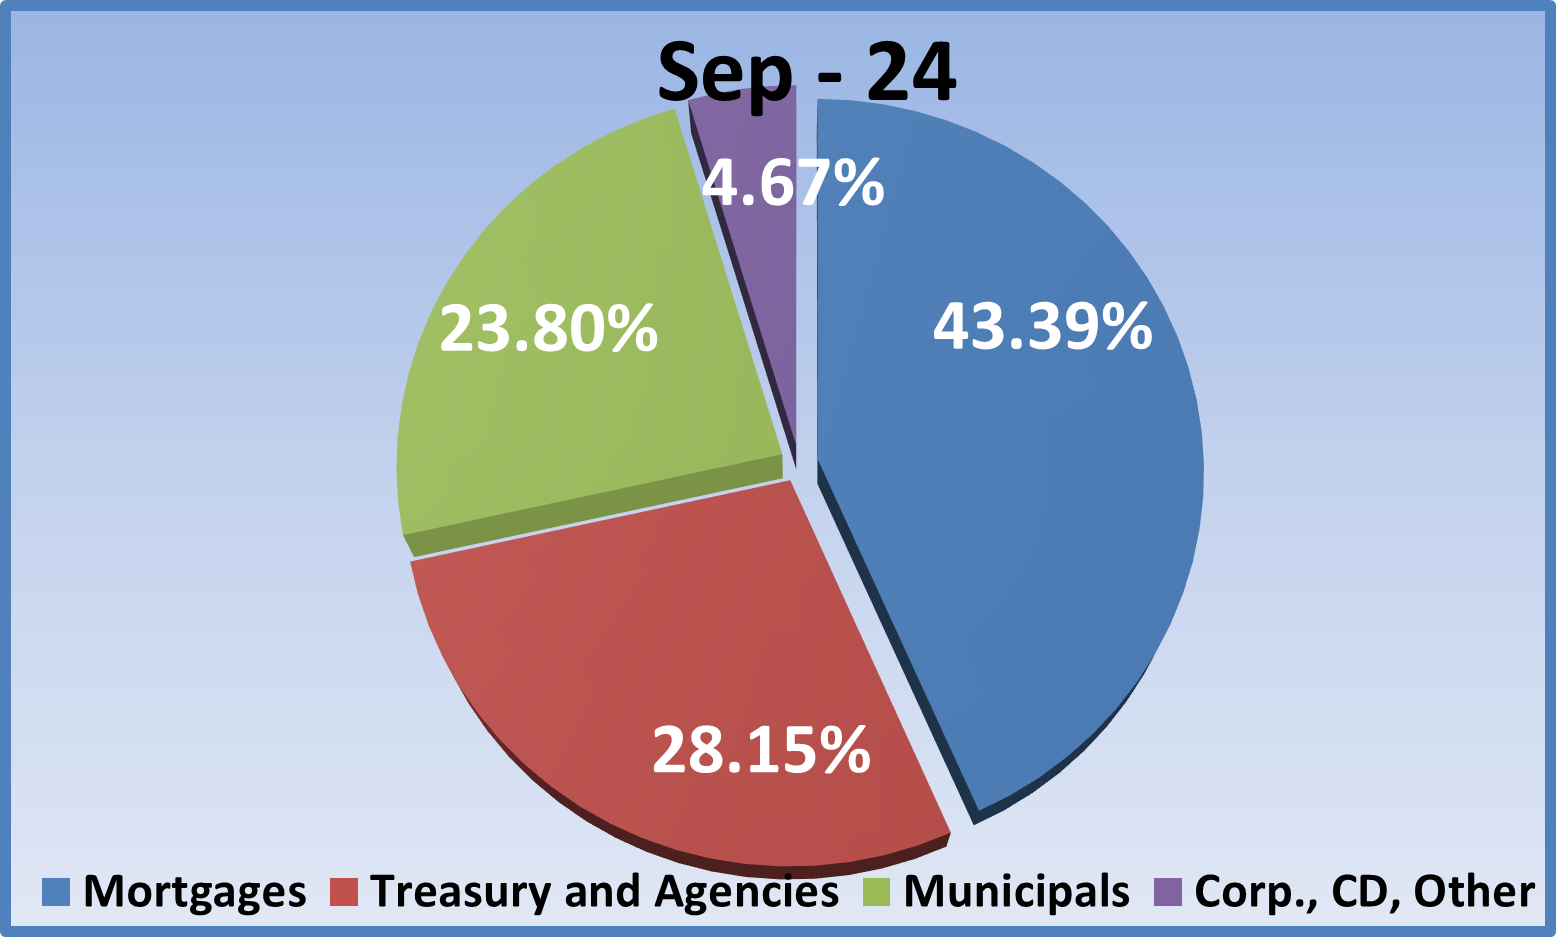
- Let’s begin our portfolio review by revisiting allocations a year ago as shown in the right pie chart below. The MBS/CMO sector comprised 41% of the portfolio, municipal allocations stood at 23%, Agency/Treasury investments were 31%, and the “Other” category) CDs, corporates, and other floaters) 5.6%.
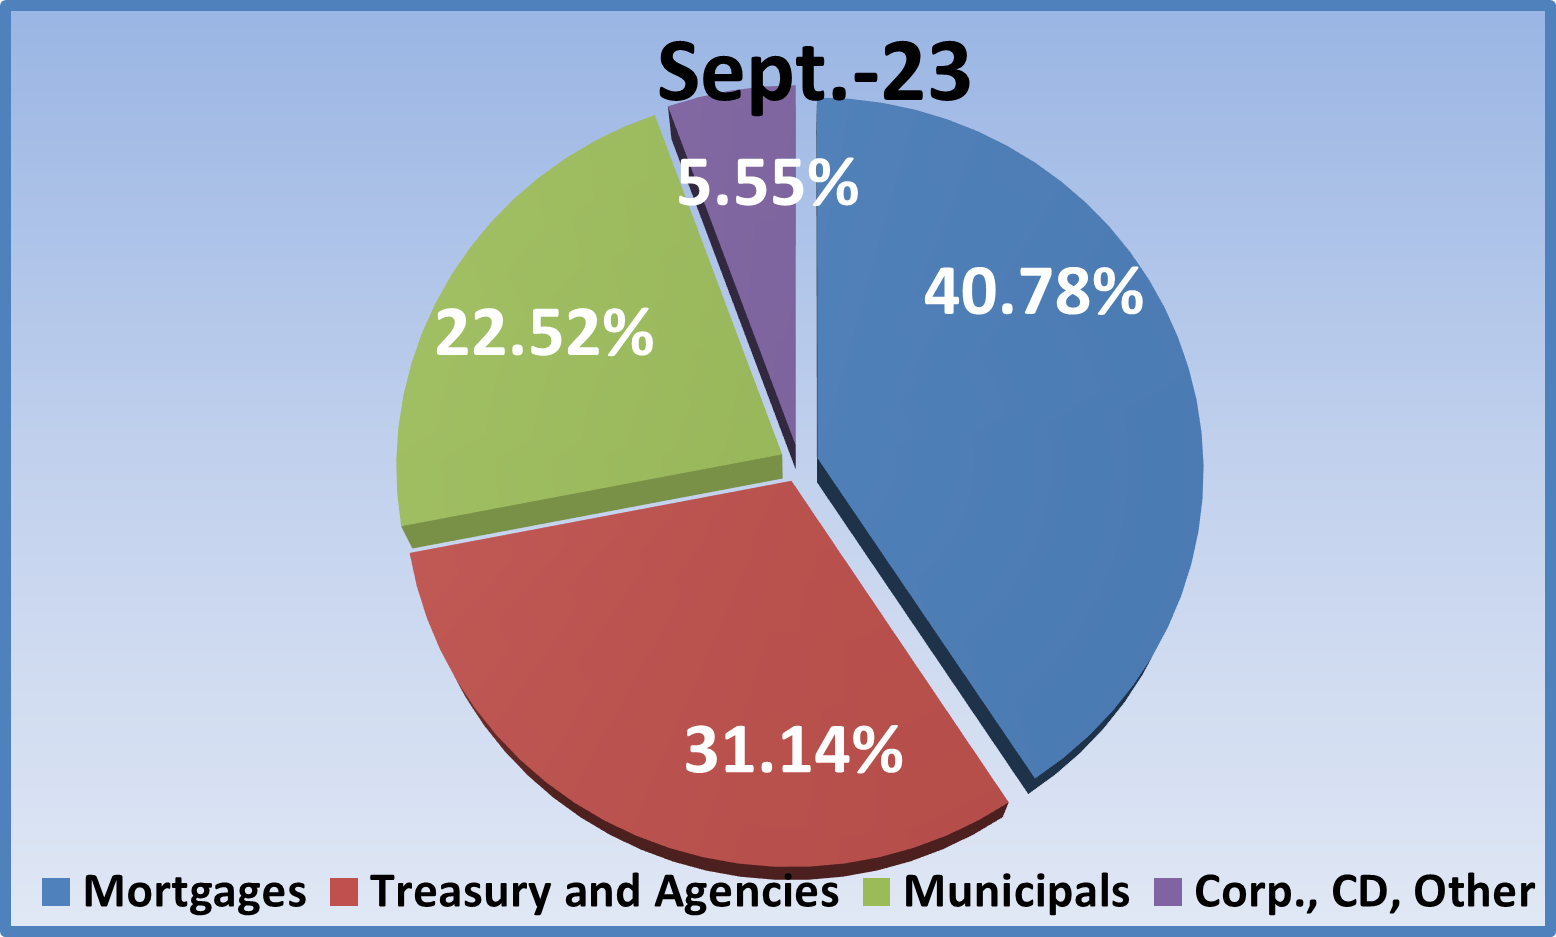
- Fast forward one year to September 30, 2024. The MBS/CMO sector comprised 43% of the portfolio, a 2% increase from last year. This repeats the experience of the previous three quarters which halted a six quarter trend of declining MBS allocations. Previous to the hiking cycle, MBS tended to lead portfolio investments by a wide margin, close to 50% of total allocations.
- The decrease in municipal investments that had been a feature for much of 2023 stopped in the fourth quarter and that modest increase in allocation has continued throughout 2024 with 23.8% in the sector (16.4% tax-free, 7.4% taxable). That is just over 1% above the year ago level. The stable, to slightly higher, investment allocation is an improvement over the run-off that had been a feature once the hiking cycle started in March 2022.
- The Agency/Treasury sector had been the one area that experienced increased allocations during the hiking cycle, but for the fourth straight quarter allocations declined from 31.1% a year ago to 28.2% this year as the MBS and muni sectors finally started to entice investors back to those sectors. The “Other” category was slightly smaller at4.67% versus 5.55% a year ago with corporate bonds constituting more than 80% of the category.
Changes in Portfolio Performance
Now let’s look at portfolio performance trends. The graph below tracks average portfolio tax-equivalent book yield, duration, and unrealized gain/(loss) as a percent of book value. It also tracks 10-year Treasury yields and average portfolio size over the last two years.
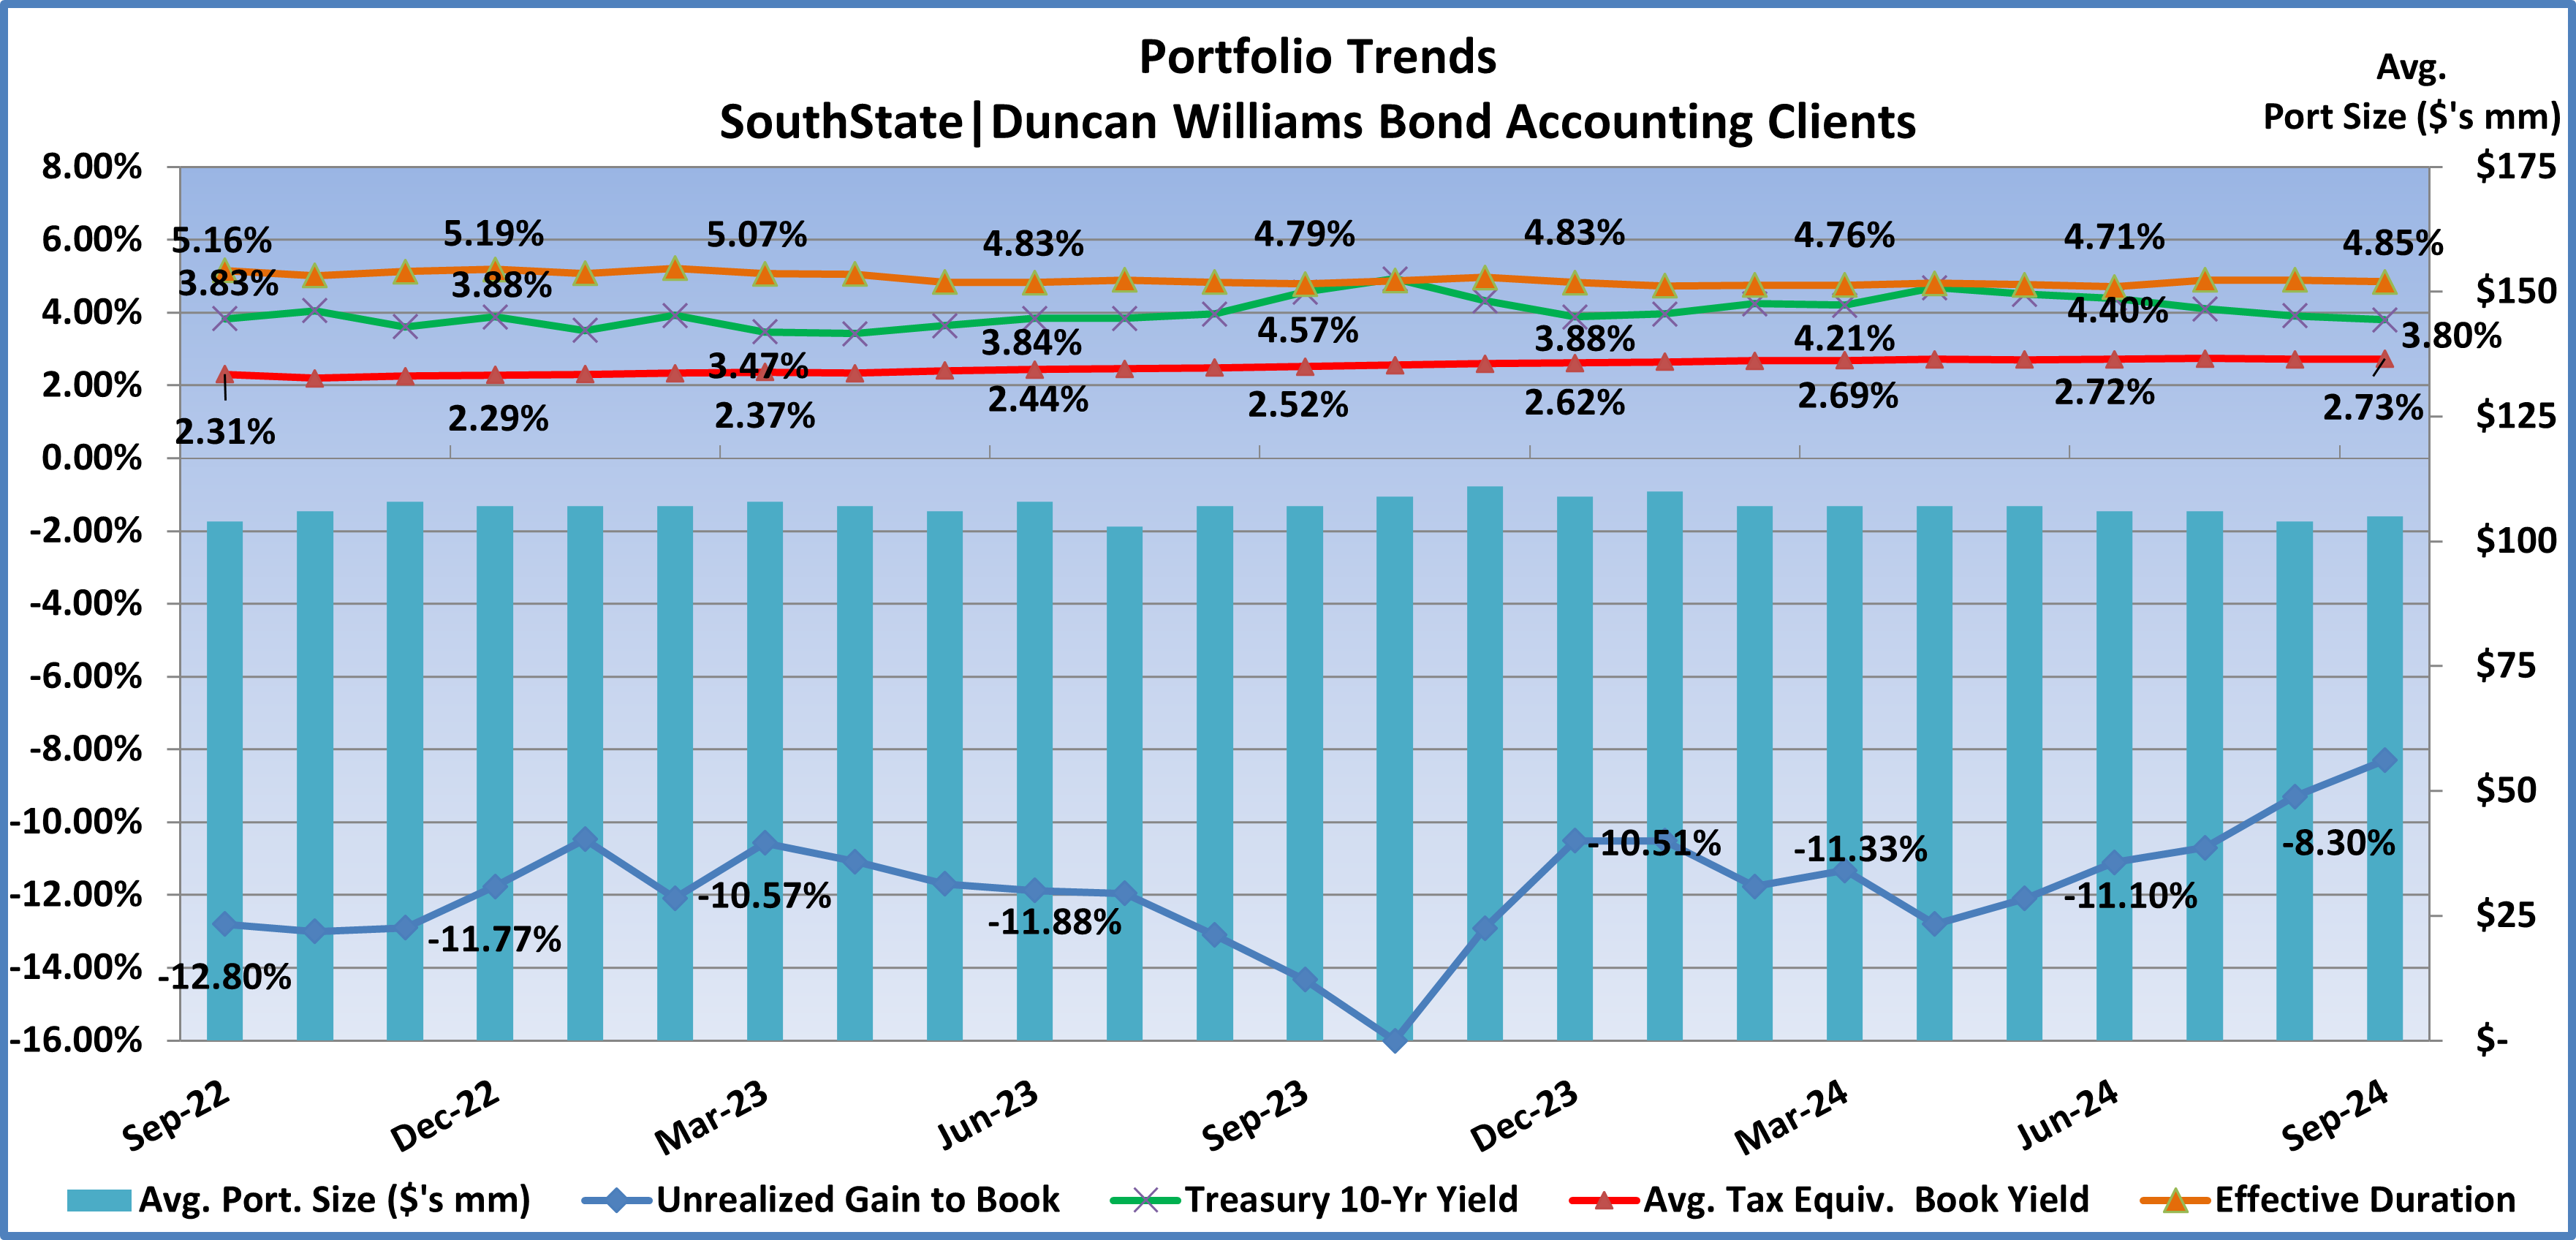
- Portfolio yields averaged 2.52% (red line) a year ago. Yields slowly rose through the year as reinvestments were made at higher market yields, albeit on a modest basis. By the third quarter, yields increased 21bps over the prior twelve months to 2.73%, but improved only 1bp from the second quarter. We were typically seeing 7 to 8bp quarterly improvement in yields in 2023. With higher market yields in 2024, portfolio yields should continue increase as lower yielding legacy bonds are reinvested at higher market yields. But we are now seeing earlier purchases in the rate-hiking period start to mature so the yield increase is starting to slow markedly.
- 10-year Treasury yields (green line) began the year at 3.88%, quite the rally from when yields peaked mid-October at 4.99%, the cycle high. With the cooler inflation readings during the second quarter, not to mention slowing in the labor market, 10yr yields trended lower throughout the third quarter, and as the Fed pivoted in August and set the stage for rate cuts beginning at the September FOMC meeting.
- Durations a year ago averaged 4.79 years and generally trended lower during the next twelve months but lifted in September to 4.85 years as short-term investments purchased early in the rate-hiking cycle started to mature and were replaced with longer duration securities as investors anticipated the beginning of the rate-cutting cycle.
- The slight increase in duration and the decrease in interest rates during the quarter resulted in an improved unrealized loss. Unrealized losses decreased from –11.10% to –8.30% as a percent of book. While still a sizeable number, it’s quite the improvement from the –16.00% cycle low in October 2023.
Portfolio Purchases During the Third Quarter 2024
- New investments during the quarter increased modestly from $501 million in the second quarter to $645 million, or $4.96 million on average per portfolio. The run rate prior to the pandemic was approximately $1.2 billion, so still quite the drop off. After ten straight quarters leading allocations, the Treasury/agency sector was passed by the MBS/CMO/SBA category, resuming it’s pre-pandemic pole position. Investments in MBS/CMO/SBA totaled 56% well ahead of the legacy 43% total. 30yr fixed-rate pools led MBS investments at 68% of the sector total and 33% of total investments. The municipal sector was lapped by the top two categories at just 3.5% of purchases, ( 2.4% tax-free, 1.1% taxable). The 3.5% in muni purchases compares to a 24% legacy muni allocation.
- Average tax-equivalent book yield for second quarter purchases was 4.66% versus 5.14% in the prior quarter, a 48bps reduction as a result of the strong market rally during the quarter. The average effective duration was 3.81 years versus 2.49 years in the prior quarter, as investors started buying longer duration bonds in anticipation of Fed rate cuts. Negative convexity was –0.20 versus –0.21 in the prior quarter. Compare those figures to the legacy portfolio book yield of 2.73% and effective duration of 4.85 years.
We will update this data again in January to track how allocations and performance characteristics trended in the fourth quarter of 2024.
Securities offered through the SouthState | DuncanWilliams 1) are not FDIC insured, 2) not guaranteed by any bank, and 3) may lose value including a possible loss of principal invested. SouthState | DuncanWilliams does not provide legal or tax advice. Recipients should consult with their own legal or tax professionals prior to making any decision with a legal or tax consequence. The information contained in the summary was obtained from various sources that SouthState | DuncanWilliams believes to be reliable, but we do not guarantee its accuracy or completeness. The information contained in the summary speaks only to the dates shown and is subject to change with notice. This summary is for informational purposes only and is not intended to provide a recommendation with respect to any security. In addition, this summary does not take into account the financial position or investment objectives of any specific investor. This is not an offer to sell or buy any securities product, nor should it be construed as investment advice or investment recommendations.