Bond Portfolio Trends: Fourth Quarter 2024

Bond Portfolio Trends: Fourth Quarter 2024
Background
Beginning in May 2012, we started tracking portfolio trends of our bond accounting customers here at SouthState|DuncanWilliams. At present, we account for over 130 client portfolios with a combined book value of $13.8 billion (not including SouthState Bank’s portfolio), or $106 million average per portfolio. Twelve months earlier, the average portfolio size was $110 million, a 3.6% decrease over the year. Average portfolio size peaked at $111 million in November 2023.
Fourth Quarter Market Observations
- The fourth quarter of 2024 was characterized by a slowdown in improving inflation numbers, and an economy and labor market that refused to rollover. That economic resilience and stalling inflation improvement created fertile ground for a back up in yields. The Trump election in November was another catalyst to spur higher yields as his proposed policies and pro-business stance also contributed to an increased risk of higher inflation.
- While the Fed did cut 100bps between September and year-end, the December FOMC meeting projections and Powell press conference cast a decidedly “hawkish cut” to the proceedings. The Fed reduced expected 2025 cuts from 100bps to 50bps and Powell’s comments led many to believe a pause was coming in January, at the least. Futures markets are more pessimistic on rate cuts with the first cut happening in June with a total of 40bps in cuts for all of 2025. This slowing in expected rate cuts due to concerns over increased inflation risk, and minimal expected slowing in the economy, have contributed to the higher rate climate.
- During the quarter, the 10yr Treasury yield ended 80bps higher and the 2yr Treasury finished the quarter 60bps higher, effectively reversing the lower yields experienced during the third quarter. With that backdrop, let’s turn our attention to changes in portfolio allocations during the past year.
Changes in Portfolio Allocations
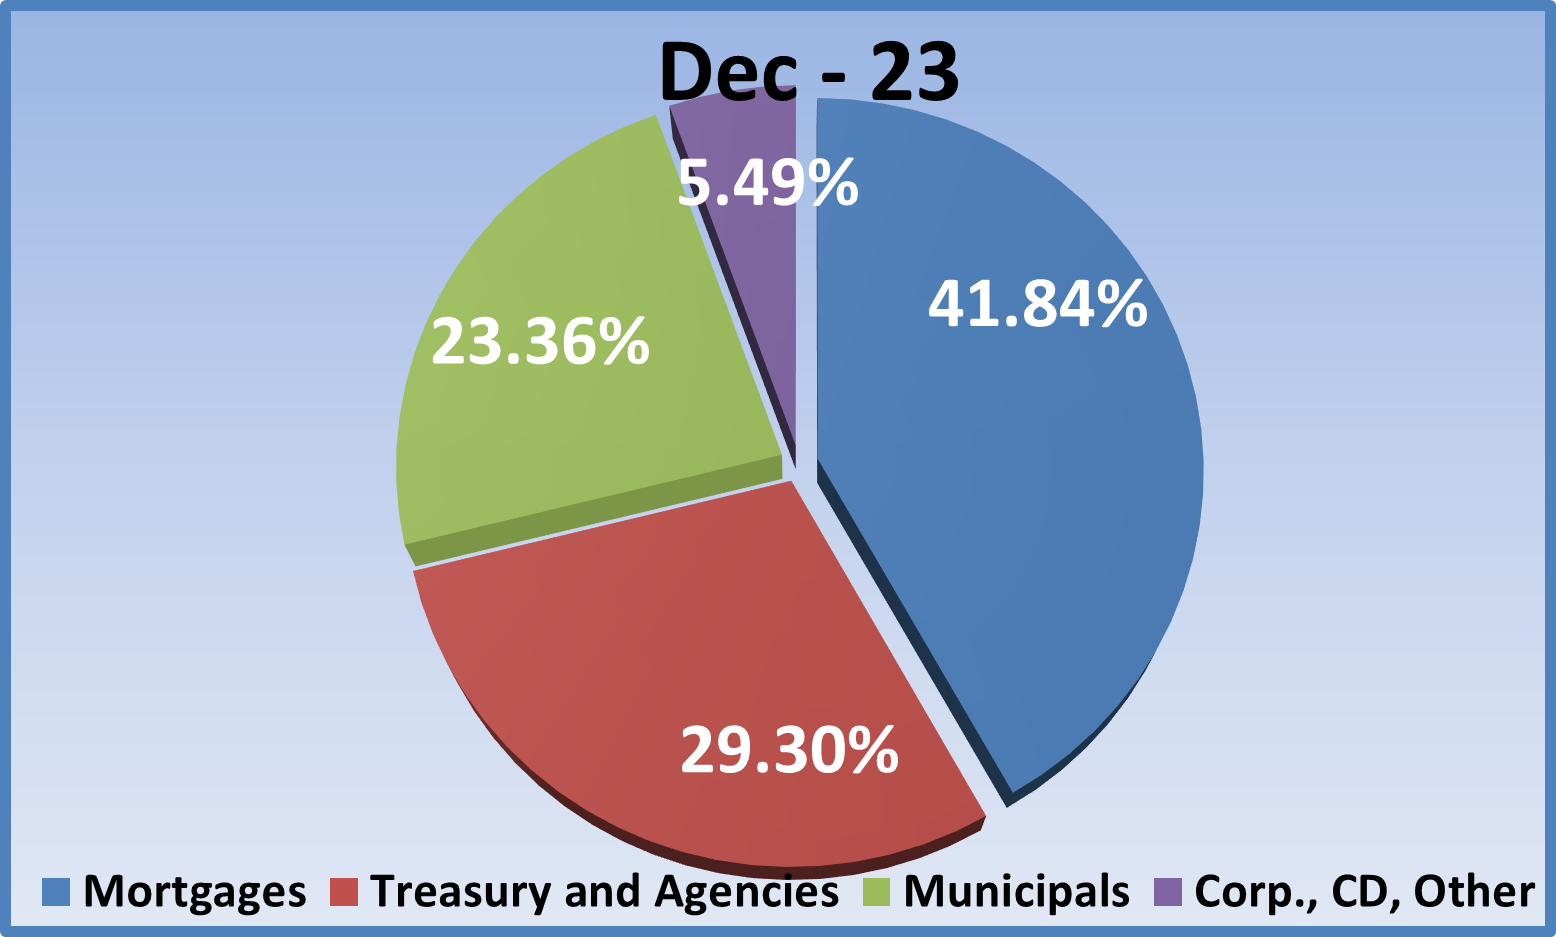
- Let’s begin our portfolio review by revisiting allocations a year ago as shown in the pie chart below. The MBS/CMO sector comprised 42% of the portfolio, municipal allocations stood at 23%, Agency/Treasury investments were 29%, and the “Other” category) CDs, corporates, and other floaters) 5.5%.
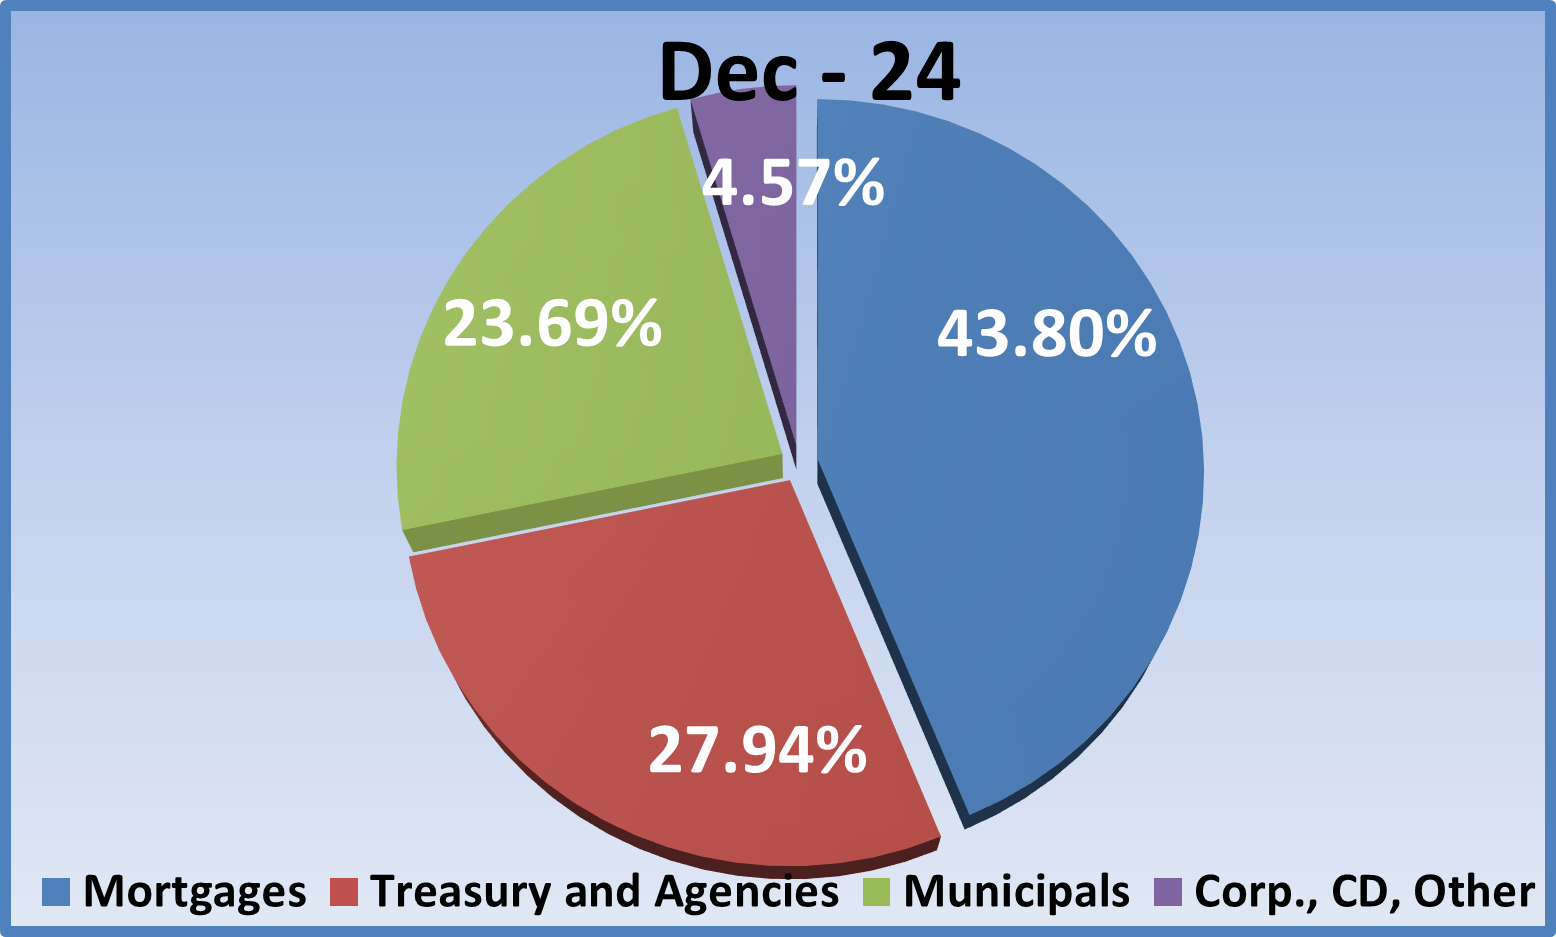
- Fast forward one year to December 31, 2024. The MBS/CMO sector comprised 44% of the portfolio, a 2% increase from last year. This repeats the experience of the previous four quarters which halted a previous six-quarter trend of declining MBS allocations. Previous to the hiking cycle, MBS tended to lead portfolio investments by a wide margin, close to 50% of total allocations.
- The decrease in municipal investments that had been a feature for much of 2023 stopped in the fourth quarter of that year and that modest increase in allocation has continued throughout 2024 with 23.7% in the sector (16.2% tax-free, 7.5% taxable). That is just over 33bps above the year ago level. The stable, to slightly higher, investment allocation is an improvement over the run-off that had been a feature once the hiking cycle started in March 2022.
- The Agency/Treasury sector had been the one sector that experienced increased allocations during the hiking cycle, but for the fifth straight quarter allocations declined from 29.3% a year ago to 27.9% this year as the MBS and muni sectors finally started to entice investors back to those sectors. The “Other” category was slightly smaller at 4.57% versus 5.49% a year ago with corporate bonds constituting more than 83% of the category.
Changes in Portfolio Performance
Now let’s look at portfolio performance trends. The graph below tracks average portfolio tax-equivalent book yield, duration, and unrealized gain/(loss) as a percent of book value. It also tracks 10-year Treasury yields and average portfolio size over the last two years.
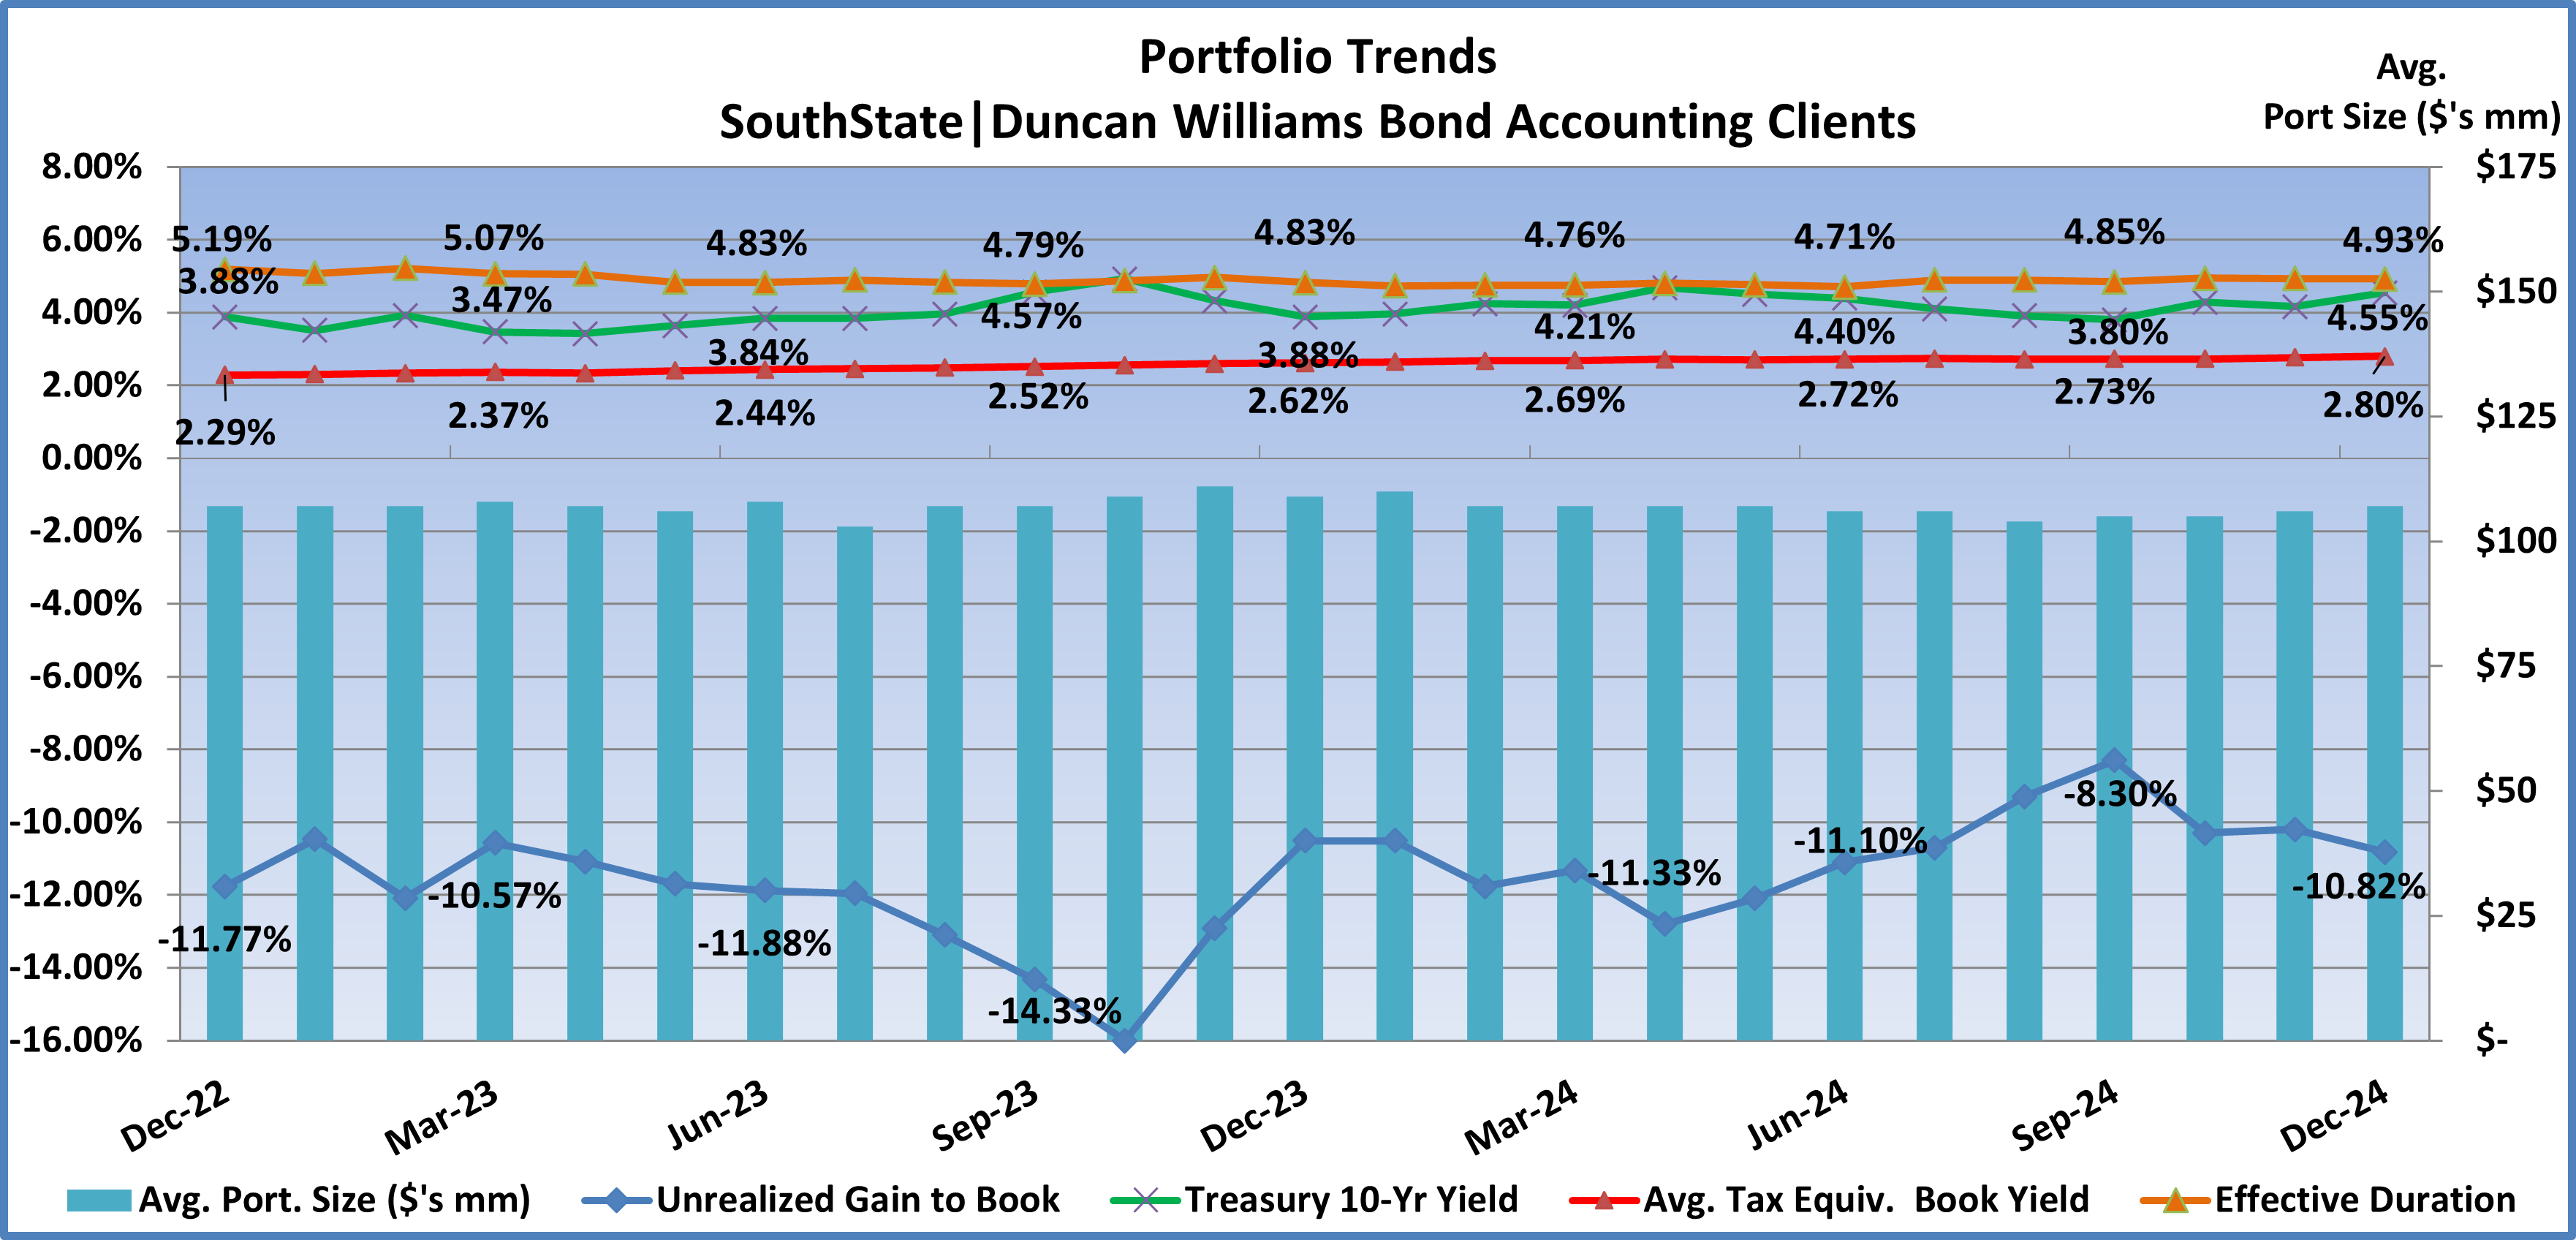
- Portfolio yields averaged 2.62% (red line) a year ago. Yields slowly rose through the year as reinvestments were made at higher market yields, albeit on a modest basis. By the fourth quarter, yields increased 18bps over the prior twelve months to 2.80%, and improved 7bps from the third quarter. We have typically been seeing 7 to 8bps in quarterly improvement in yields over the last two years. With higher market yields in 2024, portfolio yields should continue to increase as mid-2% yielding legacy bonds mature and are reinvested at higher market yields.
- 10-year Treasury yields (green line) began the year at 3.88%. The higher inflation readings during the first quarter sent yields higher and after a brief summer rally, yields continued higher into year-end as inflation improvement stalled, and economic growth proved more resilient than expected. The 10yr yield finished the year at 4.55%, an increase of 67bps during the year.
- Durations a year ago averaged 4.83 years and trended lower during the first half of 2024 but lifthed in the third and fourth quarters as higher rates slowed prepayment and call expectations. Durations ended the year at 4.93 years, the highest since March 2023 when they were 5.07 years.
- The increase in duration and interest rates during the quarter resulted in greater unrealized losses. Unrealized losses during the quarter increased from –8.30% to –10.82% as a percent of book. While still a sizeable number, it’s quite the improvement from the –16.00% cycle low in October 2023.
Portfolio Purchases During the Fourth Quarter 2024
- New investments during the quarter increased significantly from $645 million in the third quarter to $895 million, or $6.88 million on average per portfolio. By way of comparison, in the fourth quarter 2023, purchases totaled $530 million. So, purchases are accelerating in the face of the Fed turning from rate hikes to cuts in late 2024. However, the run rate prior to the pandemic was approximately $1.2 billion per quarter, so just above half the pre-pandemic rate, but it is increasing on a quarterly basis.
- After ten straight quarters leading allocations, the Treasury/agency sector was passed by the MBS/CMO/SBA category in the third quarter, resuming it’s pre-pandemic pole position, but Treasury/agency edged back into the lead in the fourth quarter with investments of 48% of total purchases (Treasury 40%, agency 8%). The 48% total compares to a legacy total of 28%. Investments in MBS/CMO/SBA totaled 45% just ahead of the legacy 44% total. 30yr fixed-rate pools led MBS investments at 41% of the sector total and 16% of total investments. The municipal sector was lapped by the top two categories at just 4.5% of purchases, ( 3.1% tax-free, 1.4% taxable). The 4.5% in muni purchases compares to a 24% legacy muni allocation.
- Average tax-equivalent book yield for fourth quarter purchases was 4.66%, matching the prior quarter. The average effective duration was 2.82 years versus 3.81 years in the prior quarter. So, investors were able to match the third quarter yield with shorter duration bonds. Negative convexity was –0.34 versus –0.20 in the prior quarter. Compare those figures to the legacy portfolio book yield of 2.80% and effective duration of 4.93 years.
We will update this data again in April to track how allocations and performance characteristics trended in the first quarter of 2025.
Securities offered through the SouthState | DuncanWilliams 1) are not FDIC insured, 2) not guaranteed by any bank, and 3) may lose value including a possible loss of principal invested. SouthState | DuncanWilliams does not provide legal or tax advice. Recipients should consult with their own legal or tax professionals prior to making any decision with a legal or tax consequence. The information contained in the summary was obtained from various sources that SouthState | DuncanWilliams believes to be reliable, but we do not guarantee its accuracy or completeness. The information contained in the summary speaks only to the dates shown and is subject to change with notice. This summary is for informational purposes only and is not intended to provide a recommendation with respect to any security. In addition, this summary does not take into account the financial position or investment objectives of any specific investor. This is not an offer to sell or buy any securities product, nor should it be construed as investment advice or investment recommendations.