Bond Portfolio Trends: First Quarter 2025

Bond Portfolio Trends: First Quarter 2025
Background
Beginning in May 2012, we started tracking portfolio trends of our bond accounting customers here at SouthState|DuncanWilliams. At present, we account for over 130 client portfolios with a combined book value of $12.4 billion (not including SouthState Bank’s portfolio), or $95 million on average per portfolio. Twelve months earlier, the average portfolio size was $107 million, a 11.2% decrease over the year. Average portfolio size peaked at $111 million in November 2023.
First Quarter Market Observations
- The first quarter of 2025 was characterized by better inflation numbers vs. a year ago when they ran hot. Meanwhile, talk of tariffs hit growth expectations first rather than concerns over inflation implications. The shifting fiscal policies kept the Fed on hold, while slowing consumer consumption, and a surge of pre-tariff imports, cast doubt on first quarter growth prospects. This sent yields lower during the quarter.
- While the Fed did cut 100bps between September and year-end, the first quarter saw the Fed stand pat given the uncertain inflation picture and the still resilient hard data vs. softer survey figures. As tariff plans were unveiled, the larger scope and scale of tariffs vs. Trump 1.0 became quickly apparent and growth concerns leapt ahead of inflation worries for the market. While the Fed has remained mute over when they may cut rates again, futures markets see the next rate cut at the June or July FOMC meeting with 85bps in rate cuts priced in by year-end.
- During the quarter, the 10yr Treasury yield ended 50bps lower and the 2yr Treasury finished the quarter 23bps lower. With that backdrop, let’s turn our attention to changes in portfolio allocations during the past year.
Changes in Portfolio Allocations
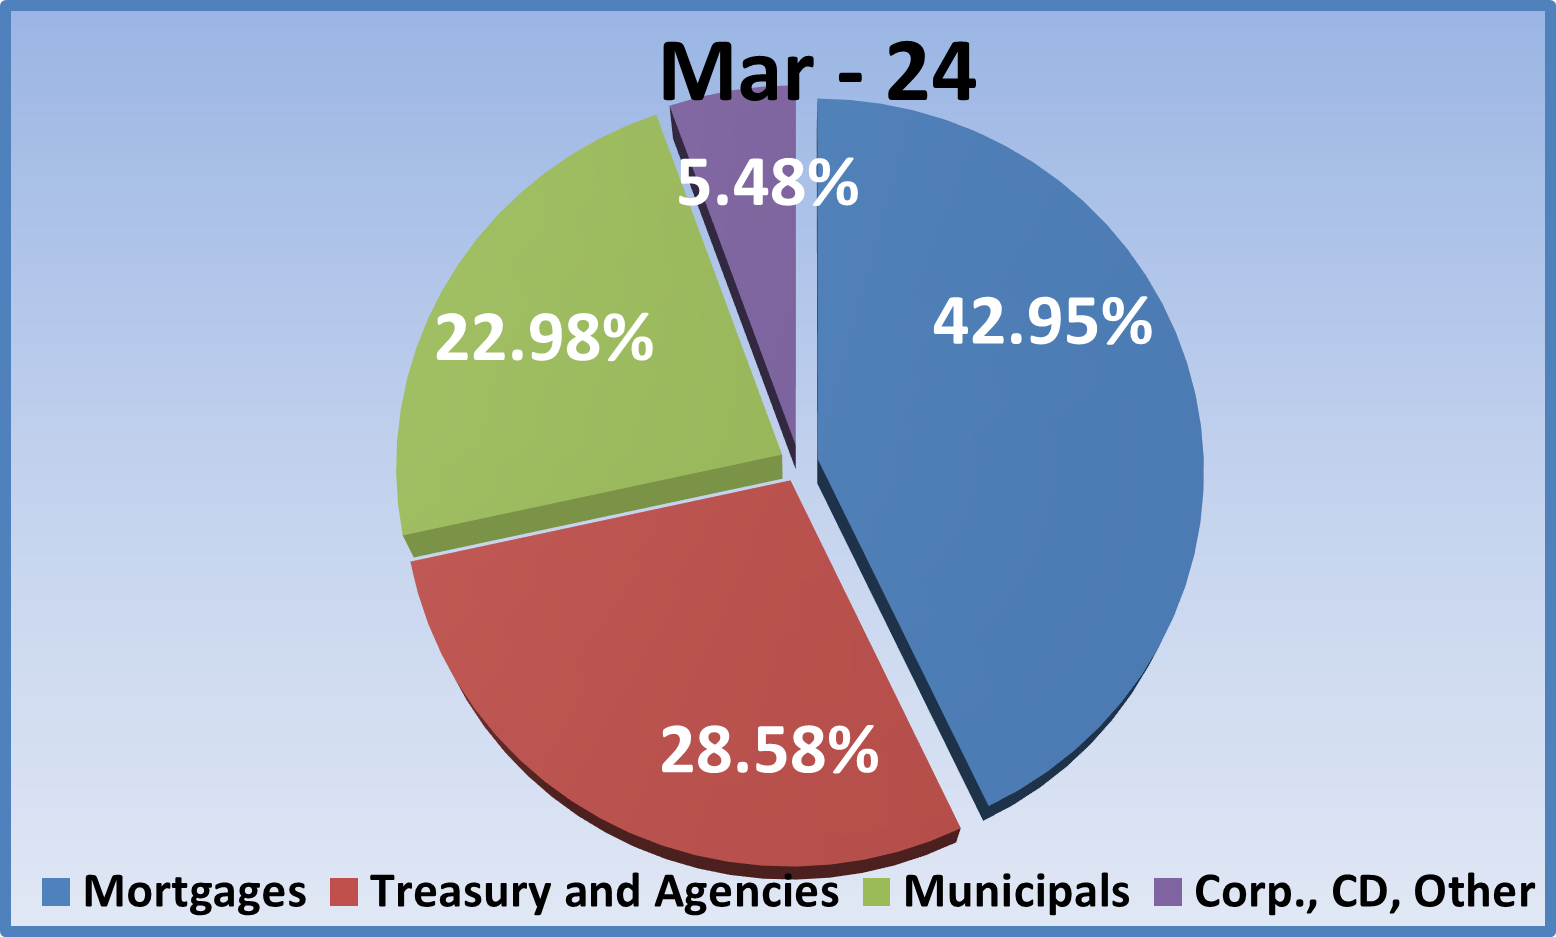
- Let’s begin our portfolio review by revisiting allocations a year ago as shown in the pie chart below. The MBS/CMO sector comprised 43% of the portfolio, municipal allocations stood at 23%, Agency/Treasury investments were 29%, and the “Other” category) CDs, corporates, and other floaters) 5.5%.
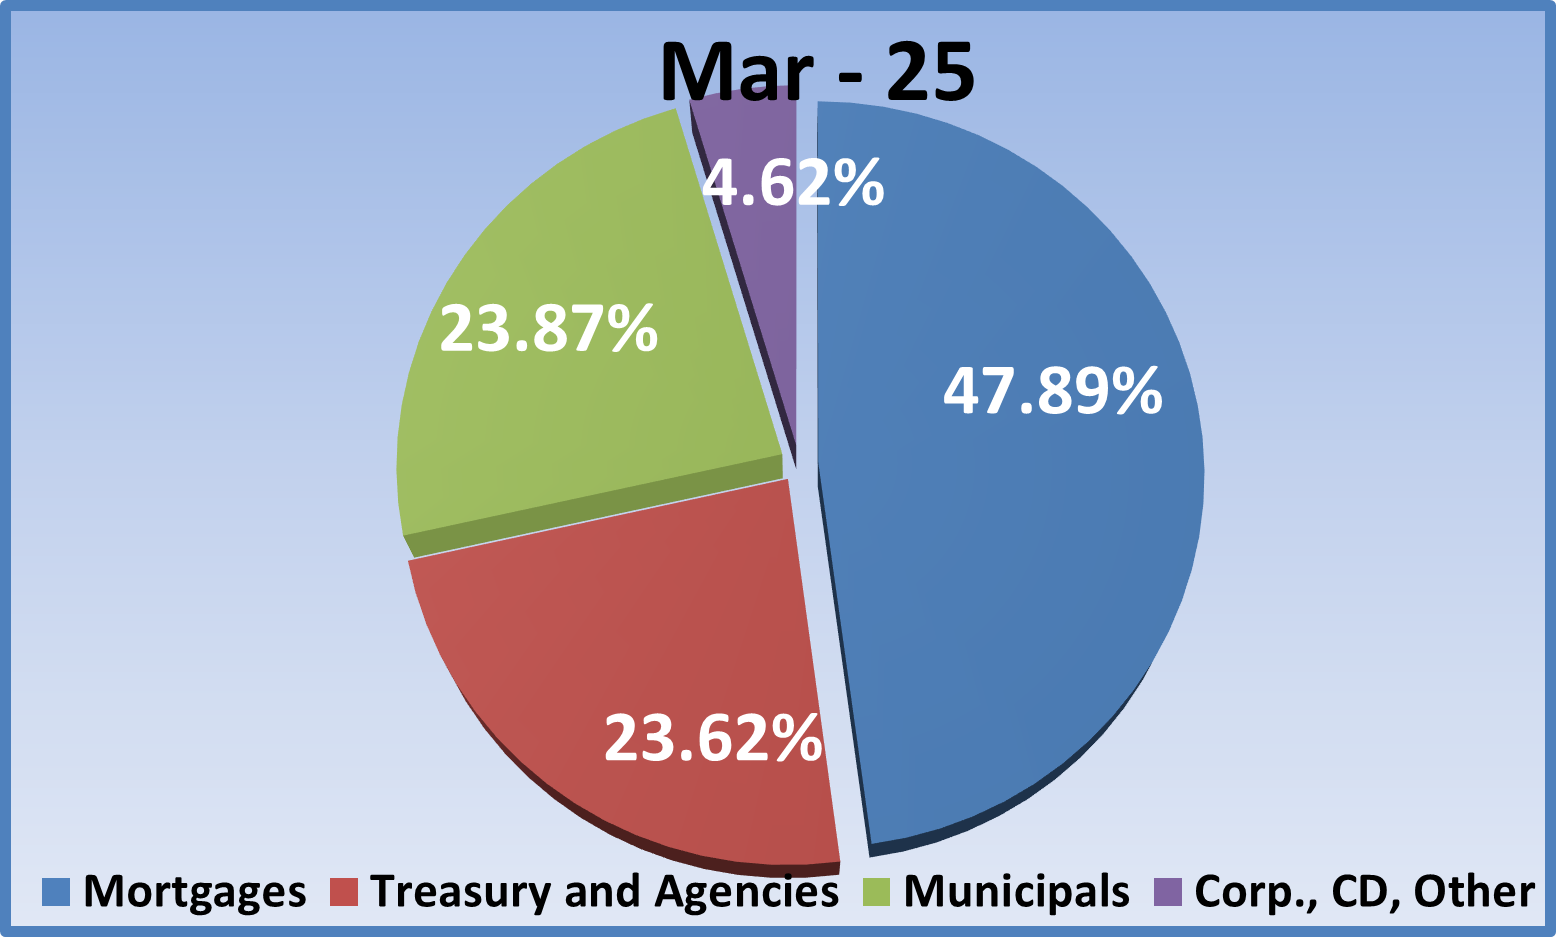
- Fast forward one year to March 31, 2025. The MBS/CMO sector comprised 48% of the portfolio, a solid 5% increase from last year. This repeats the experience of the previous year which halted a prior six-quarter trend of declining MBS allocations. Previous to the hiking cycle, MBS tended to lead portfolio investments by a wide margin, close to 50% of total allocations.
- The decrease in municipal investments that had been a feature for much of 2023 stopped in the fourth quarter of that year and that modest increase in allocation continued throughout 2024. During the last year ending in March, allocations slightly increased 1% (16.3% tax-free, 7.6% taxable). The stable, to slightly higher, investment allocation over the past year is an improvement over the run-off that had been a feature once the hiking cycle started in March 2022.
- The Agency/Treasury sector had been the one sector that experienced increased allocations during the hiking cycle, but for the sixth straight quarter allocations declined from 28.6% a year ago to 23.6%, a 5% decline as the MBS and muni sectors enticed investors back to those traditionally leading sectors. The “Other” category was slightly smaller at 4.6% versus 5.5% a year ago with corporate bonds constituting more than 80% of the category.
Changes in Portfolio Performance
Now let’s look at portfolio performance trends. The graph below tracks average portfolio tax-equivalent book yield, duration, and unrealized gain/(loss) as a percent of book value. It also tracks 10-year Treasury yields and average portfolio size over the last two years.
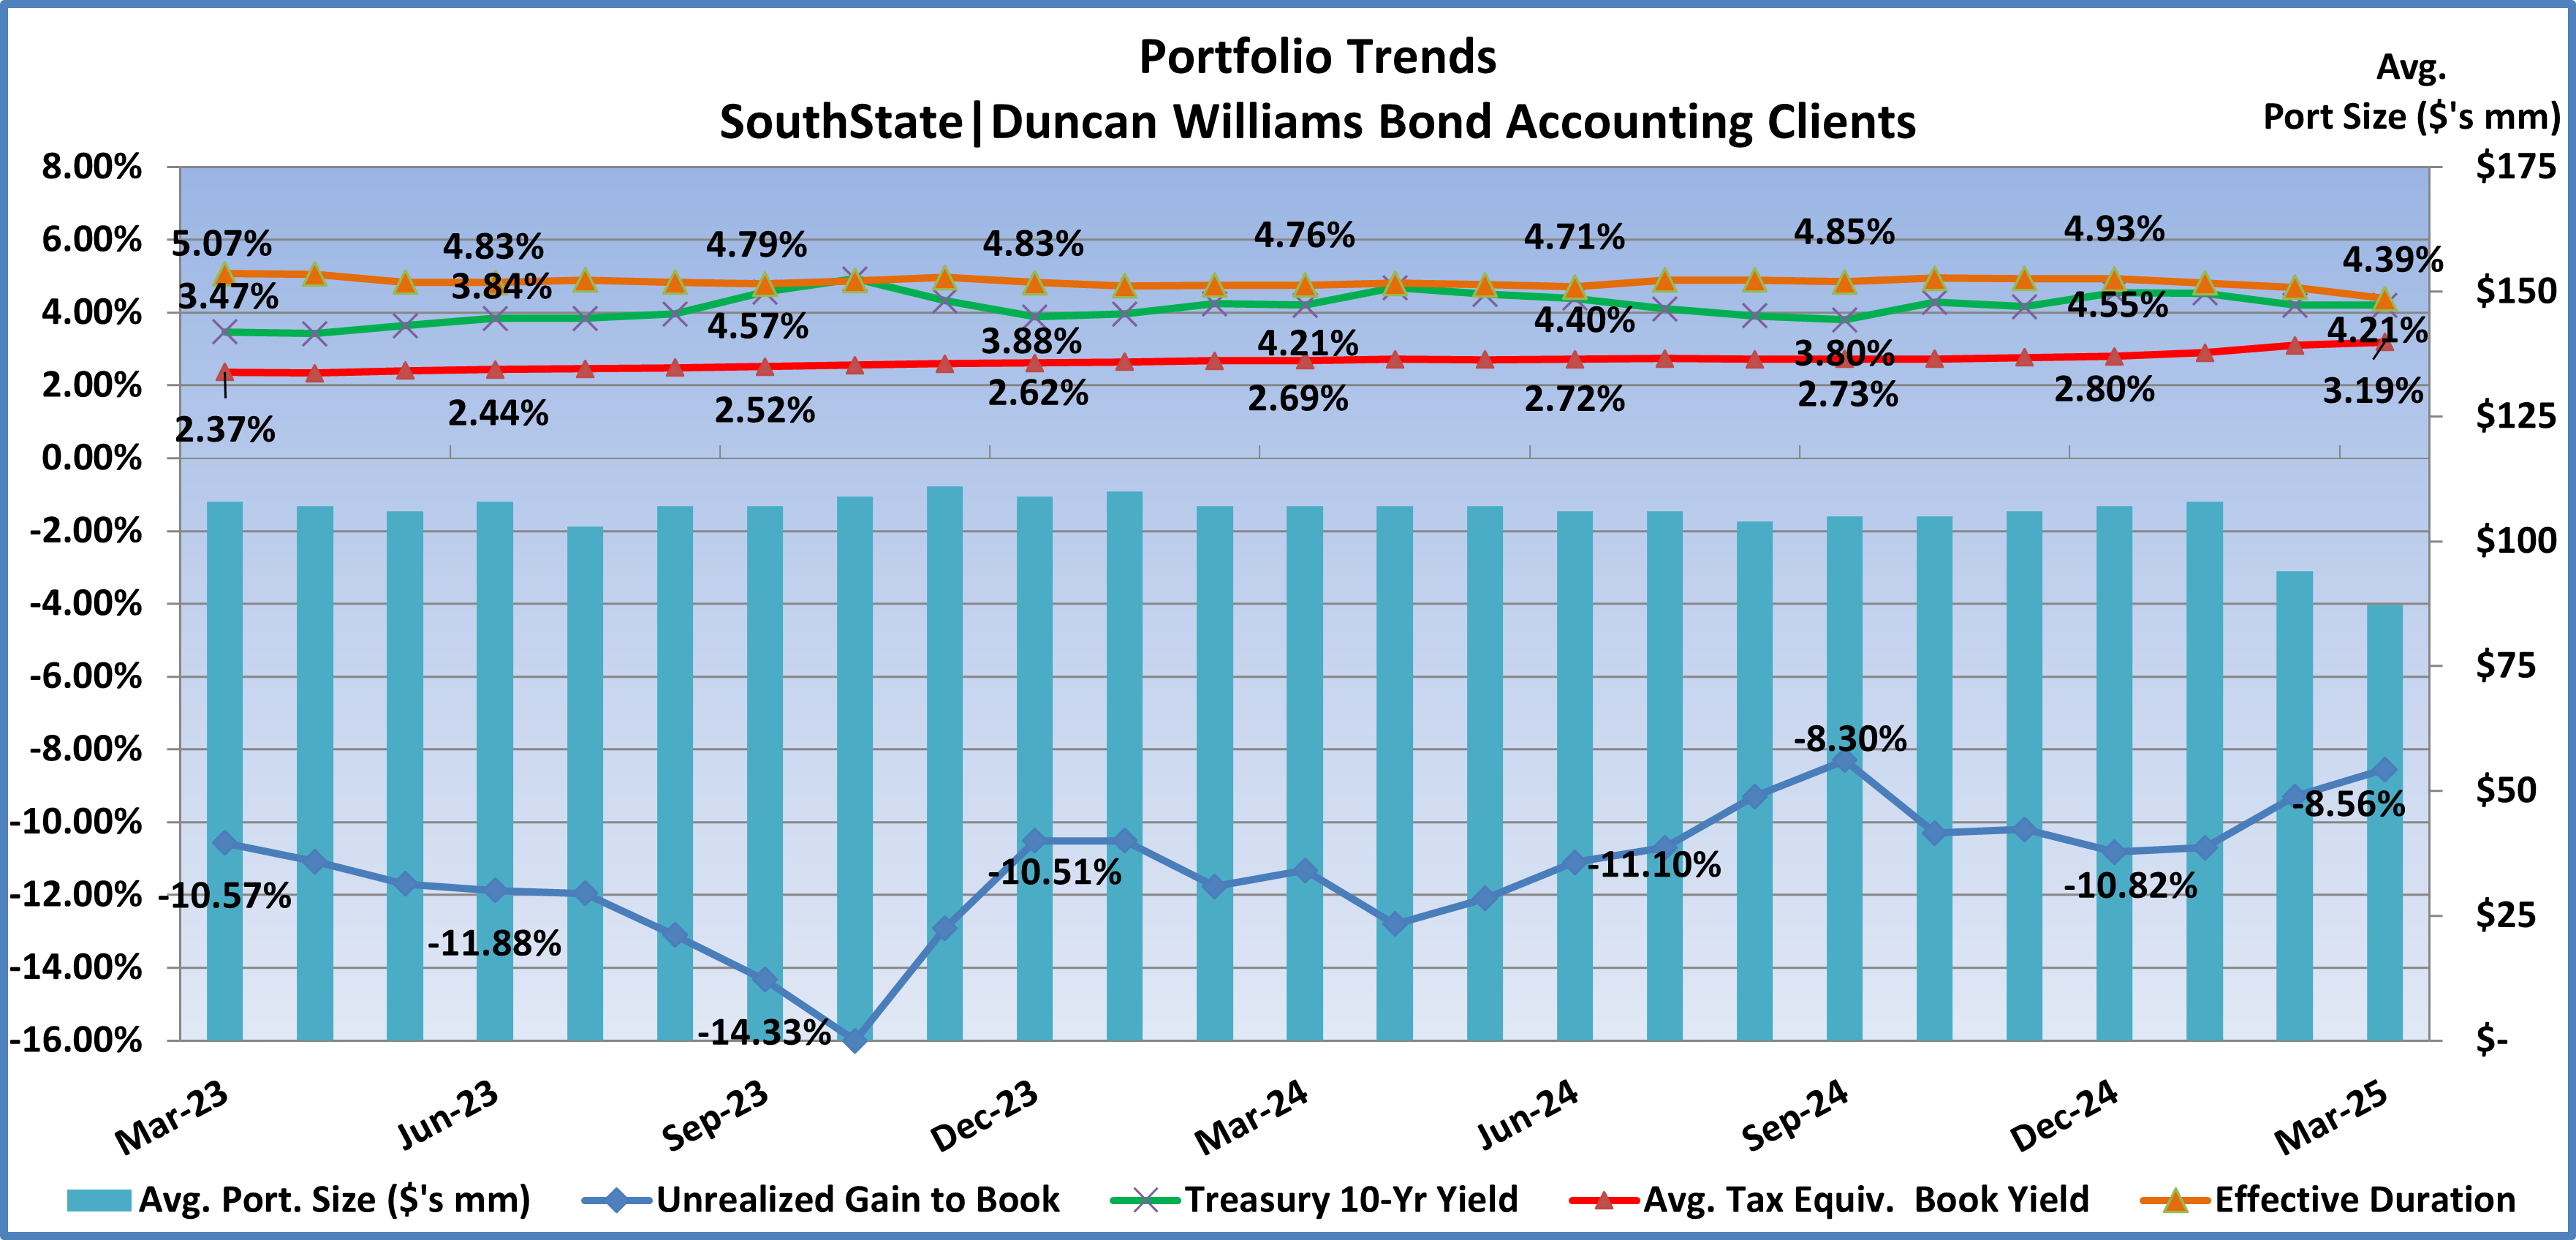
- Portfolio yields averaged 2.69% (red line) a year ago. Yields have risen through the year as reinvestments were made at higher market yields, albeit on a modest basis. By the first quarter, yields had increased 50bps over the year ago rate to 3.19%, and improved 39bps from the fourth quarter. We had been typically seeing 7 to 8bps in quarterly improvement in yields over the last two years so this most recent increase reflects a more aggressive investment posture. With higher market yields continuing in 2025, portfolio yields should continue to increase as mid-2% yielding legacy bonds mature and are reinvested at nearly double the yield, if not more.
- 10-year Treasury yields (green line) a year ago were 4.21% and 4.55% at year-end 2024. Concerns over slowing growth materialized during the first quarter of 2025 and that sent yields lower before tariff talk, and the risk of higher prices, sent yields back up in early April but the 10yr yield finished the quarter at 4.21%, a decrease of 34bps during the quarter.
- Durations a year ago averaged 4.76 years and trended higher during the second half of 2024 as higher rates slowed prepayment and call expectations. Durations ended the first quarter at 4.39 years on the back of lower Treasury yields that increased prepay and call projections along with shorter duration purchases during the quarter.
- With the decrease in duration and interest rates during the quarter unrealized losses improved. Unrealized losses during the quarter decreased from –10.82% to –8.56% as a percent of book, just below the –8.30% loss in the third quarter of 2024, which stands as the lowest unrealized loss since March 2022, when the Fed began its hiking cycle. The cycle low remains the –16.00% unrealized loss in October 2023.
Portfolio Purchases During the First Quarter 2025
- New investments during the quarter increased from $895 million in the fourth quarter to $1.024 billion, or $7.9 million on average per portfolio. By way of comparison, in the first quarter 2024, purchases totaled $683 million. So, purchases continue to accelerate in the face of the Fed shifting from rate hikes to cuts in late 2024. However, the run rate prior to the pandemic was approximately $1.2 billion per quarter, so just below the pre-pandemic pace, but getting closer.
- After ten straight quarters leading allocations, the Treasury/agency sector was passed by the MBS/CMO/SBA category in the third quarter of 2024, resuming it’s pre-pandemic pole position. The Treasury/agency edged back into the lead in the fourth quarter but MBS surged back in the first quarter. Investments in the sector accounted for 52% of total purchases (33% fixed rate, 19% adjustable). The 52% new purchase compares to a legacy total of 48%. 30yr fixed-rate pools led investments in the sector at 29% and 10% of total investments. The Treasury/Agency sector followed with 45% of total purchases. The municipal sector was lapped by the top two categories at just 1.7% of purchases, ( 1.0% tax-free, 0.7% taxable). The 1.7% in muni purchases compares to a 24% legacy muni allocation.
- Average tax-equivalent book yield for first quarter purchases was 4.71% vs. 4.66% the prior quarter. The average effective duration was 2.31 years versus 2.82 years in the prior quarter. So, investors were able to beat their fourth quarter yields but with shorter duration bonds. This is the second straight quarter with such behavior. Negative convexity was –0.31 versus –0.34 in the prior quarter. Compare those figures to the legacy portfolio book yield of 3.19% and effective duration of 4.39 years.
We will update this data again in July to track how allocations and performance characteristics trended in the first half of 2025.
Securities offered through the SouthState | DuncanWilliams 1) are not FDIC insured, 2) not guaranteed by any bank, and 3) may lose value including a possible loss of principal invested. SouthState | DuncanWilliams does not provide legal or tax advice. Recipients should consult with their own legal or tax professionals prior to making any decision with a legal or tax consequence. The information contained in the summary was obtained from various sources that SouthState | DuncanWilliams believes to be reliable, but we do not guarantee its accuracy or completeness. The information contained in the summary speaks only to the dates shown and is subject to change with notice. This summary is for informational purposes only and is not intended to provide a recommendation with respect to any security. In addition, this summary does not take into account the financial position or investment objectives of any specific investor. This is not an offer to sell or buy any securities product, nor should it be construed as investment advice or investment recommendations.